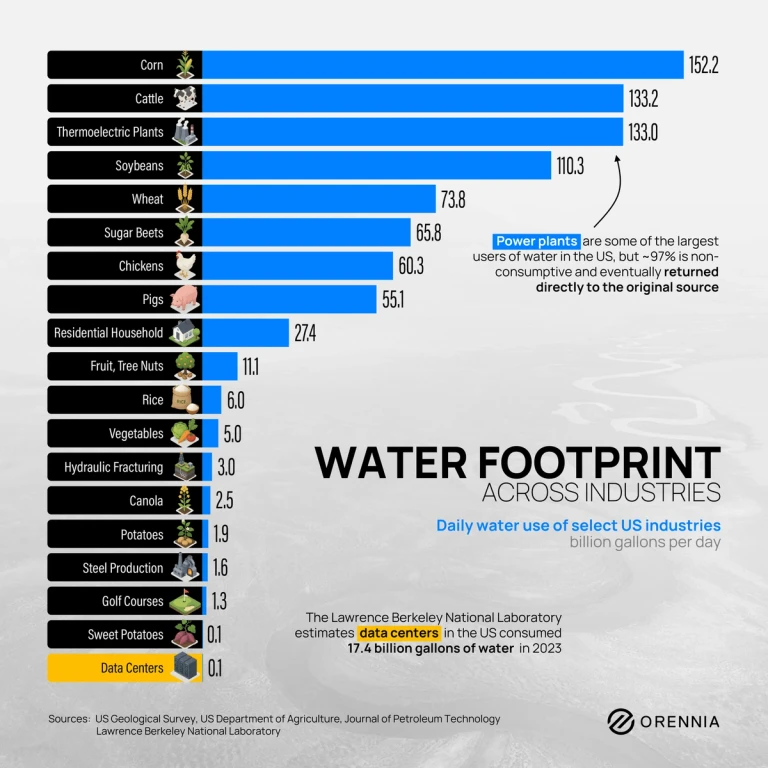
Which Industries Use the Most Water in America
Explore daily water use across US industries in billion gallons per day.
Director, Research
Aaron Foyer is Director, Research at Orennia. Prior to Orennia, he leveraged his technical background in management consulting and finance roles. He has experience across the energy landscape including clean hydrogen, renewables, biofuels, oil and gas, petrochemicals and carbon capture.

Explore daily water use across US industries in billion gallons per day.
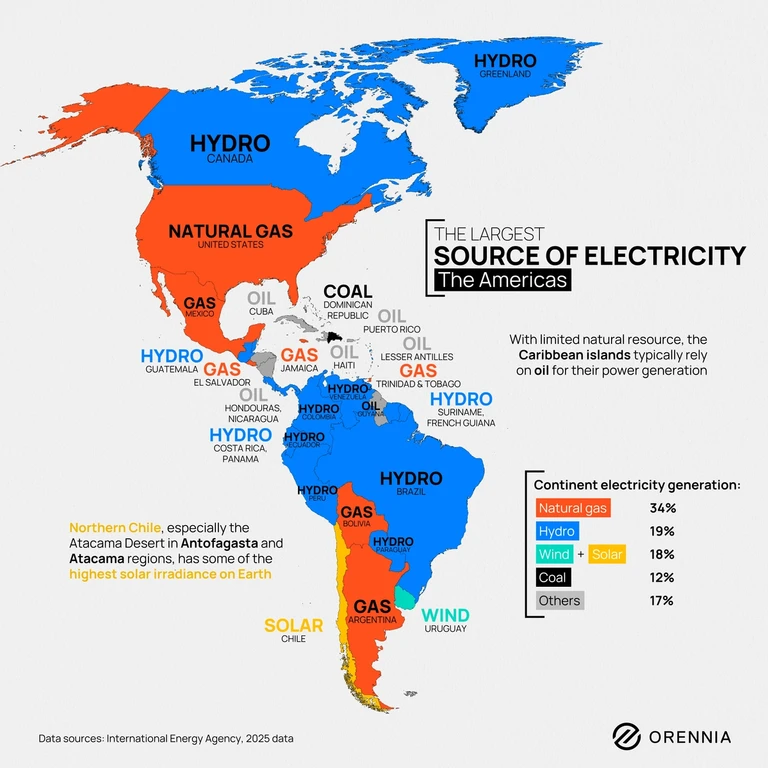
Map of the Americas showing the largest electricity source by country, including natural gas in the US and hydro across Canada and South America.
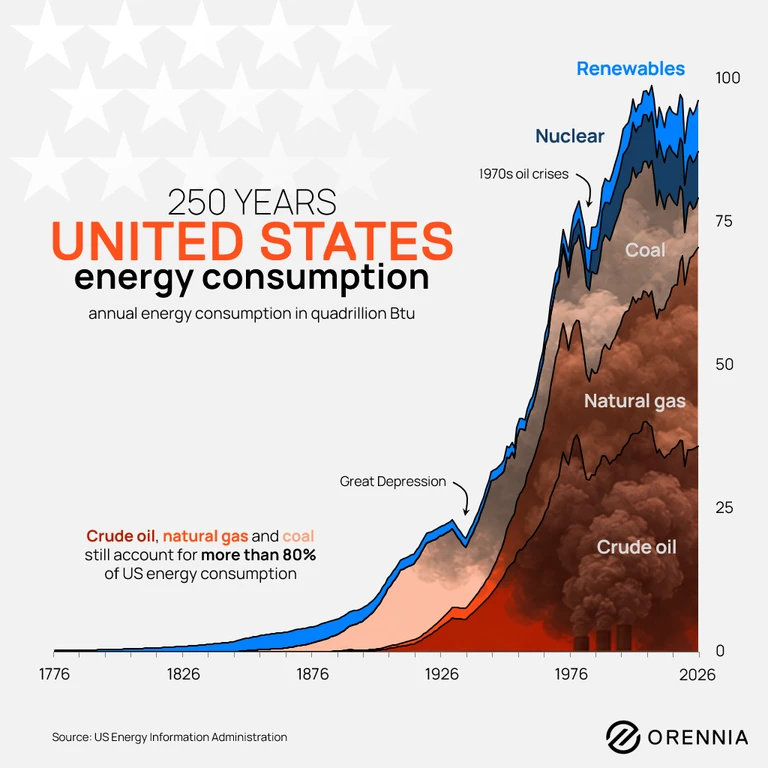
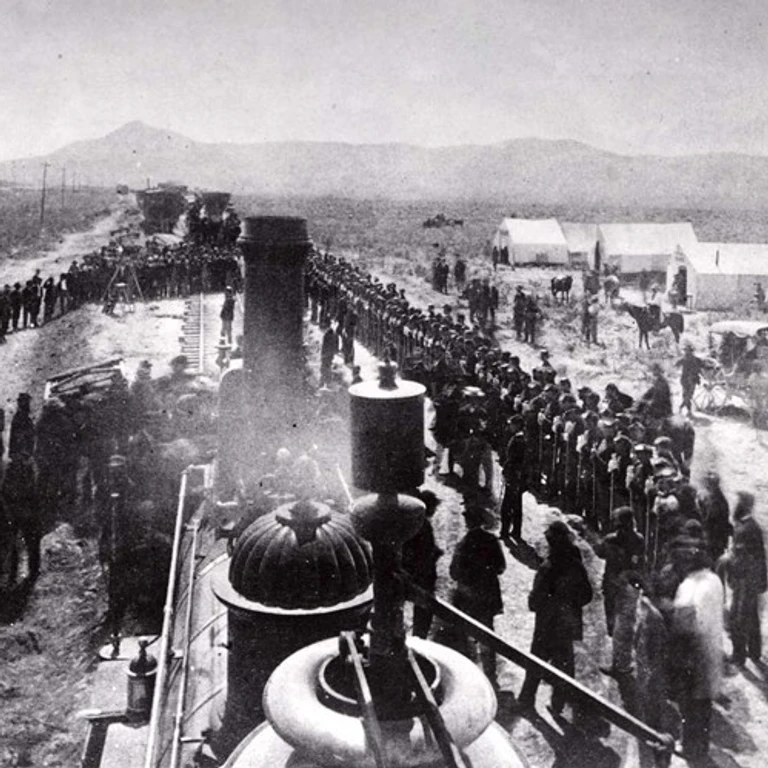
A look back at historical energy consumption in the United States over the past 250 years.
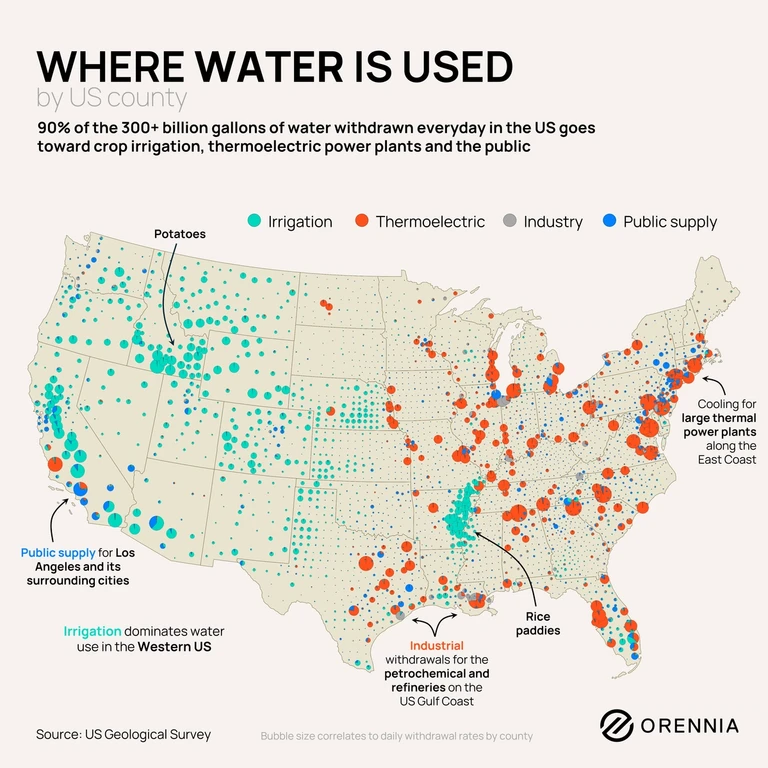
Thermoelectric power and irrigation are the two largest uses of water in the US but not all use is the same.
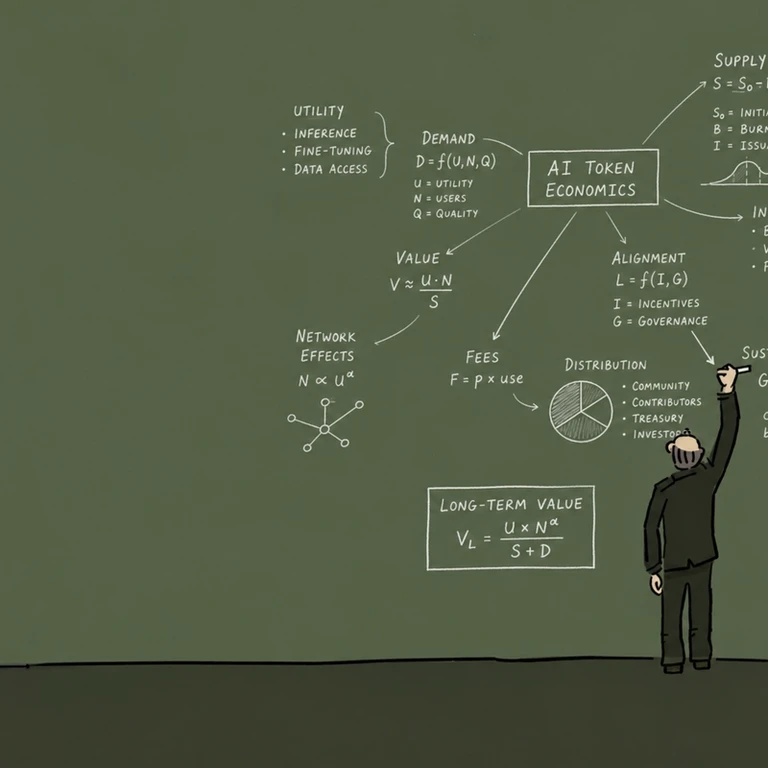
Despite token costs plummeting, corporate AI bills are going up due to use and companies are starting to ask if the cost of AI is worth it.
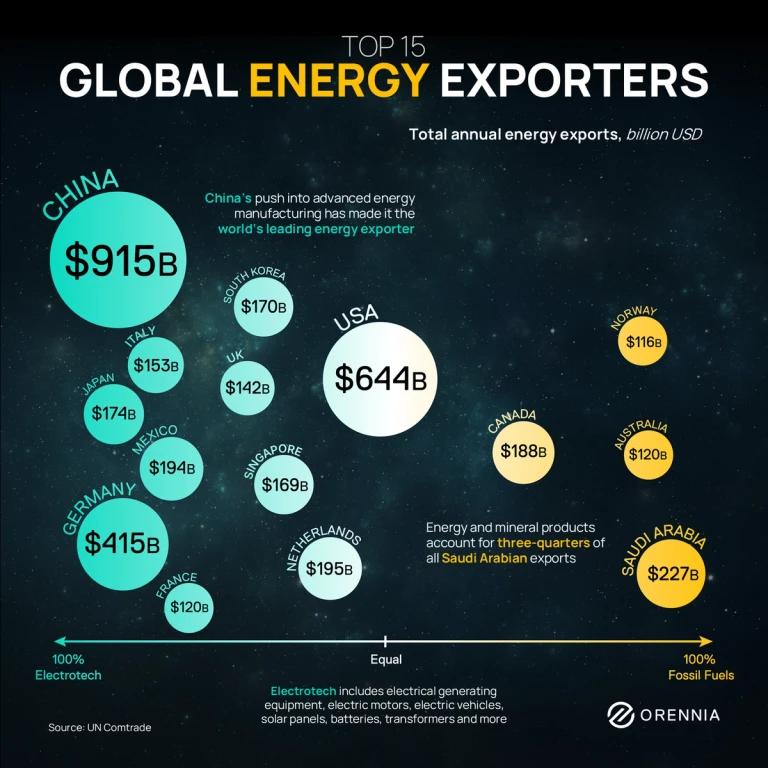
A new category of energy exporter has emerged that sells the hardware for electrification: solar panels, batteries, electric motors, transformers and grid components.

Get the recording of Heatmap and Orennia's conversation on the evolving data center landscape.
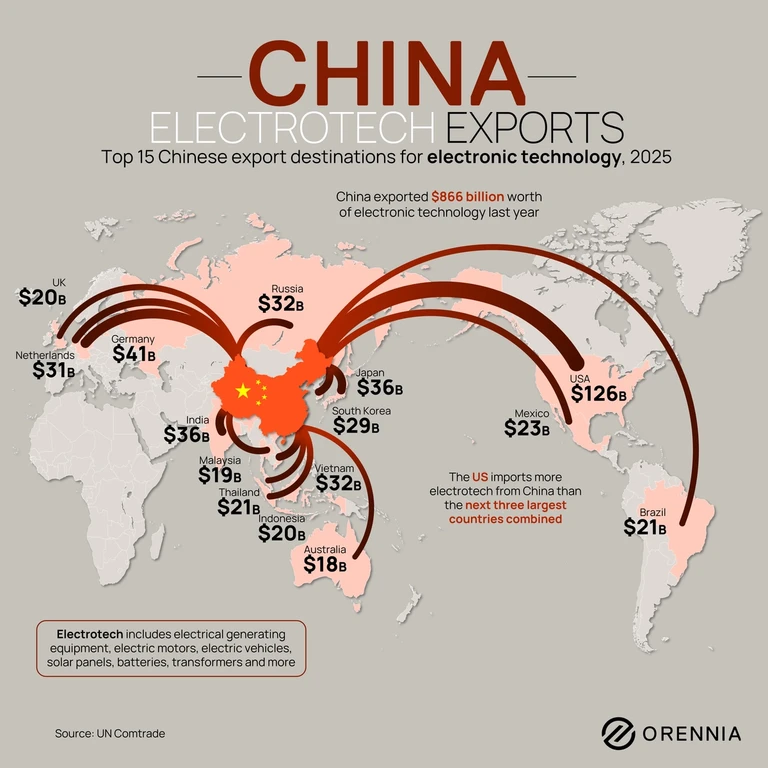
China exported $866B in electronic technology in 2025, with the US, Germany, India and Japan leading as top import markets in the global supply chain.
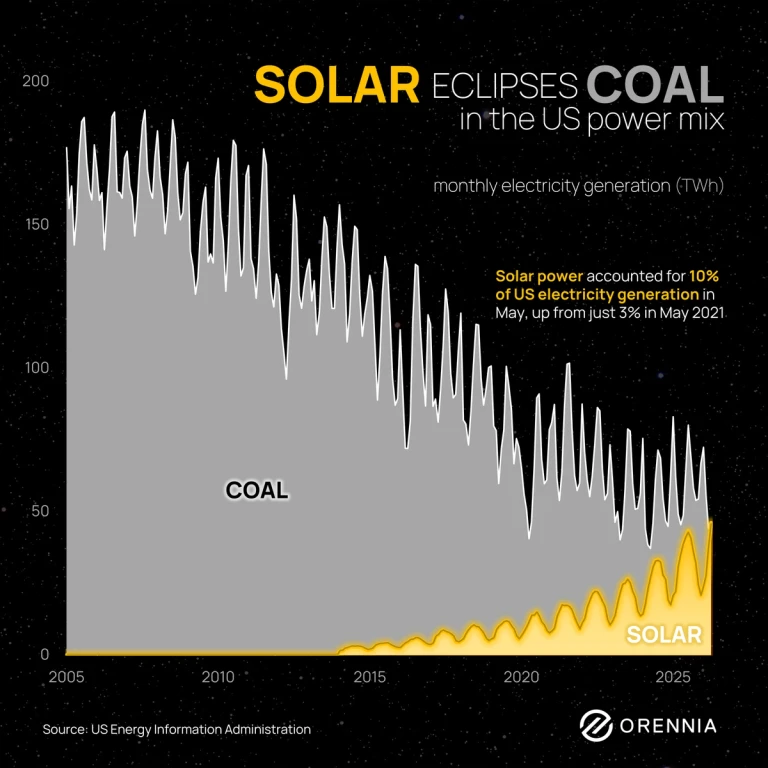
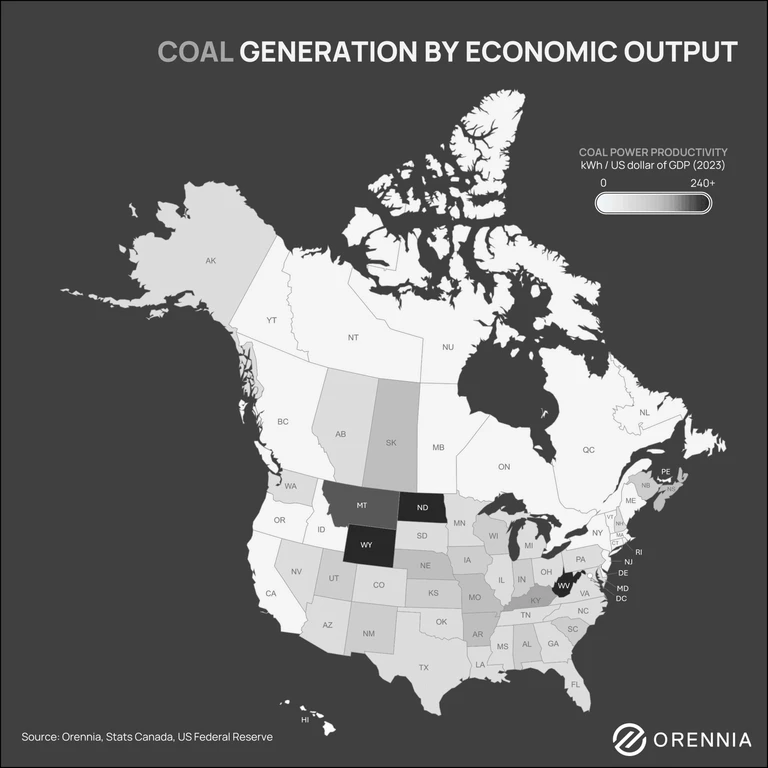
Coal's dominance in US electricity generation has seen a steady reversal over the past two decades.
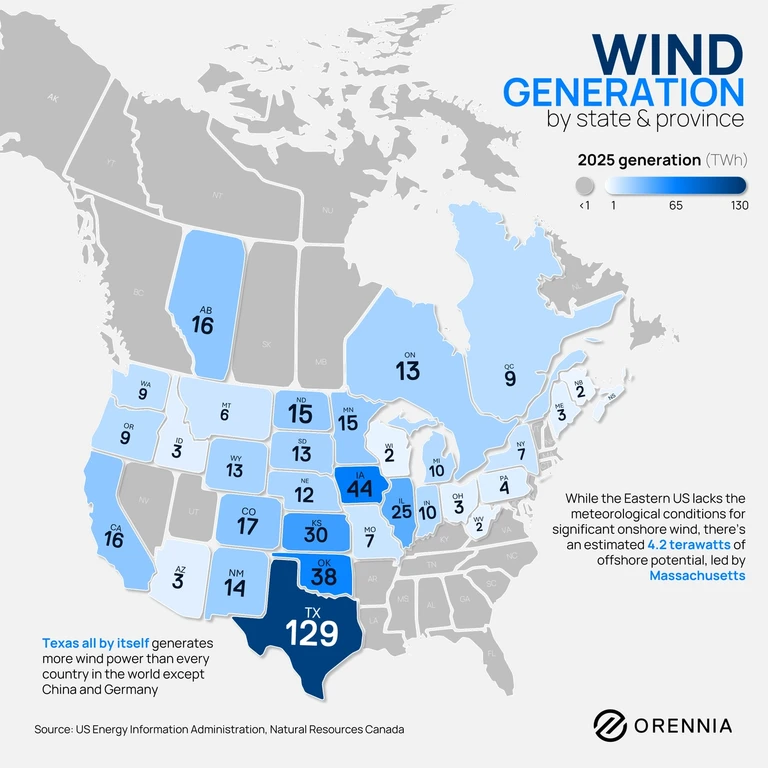
US wind capacity grew from 45 GW in 2010 to 162 GW today, and now supplies 11% of all US electricity.
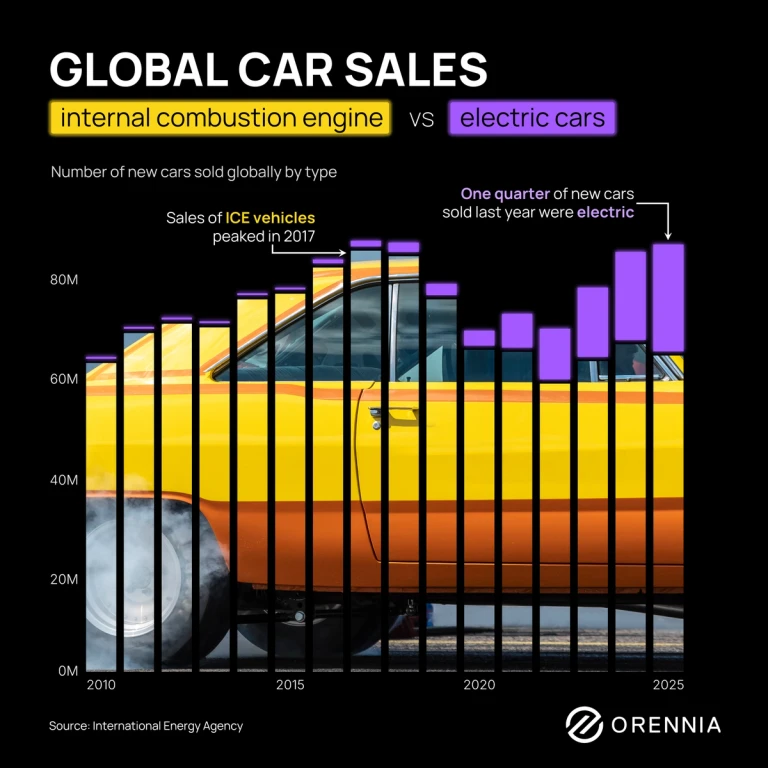
One in four new cars sold globally in 2025 was electric, totaling 20.7 million units, according to data from the International Energy Agency.
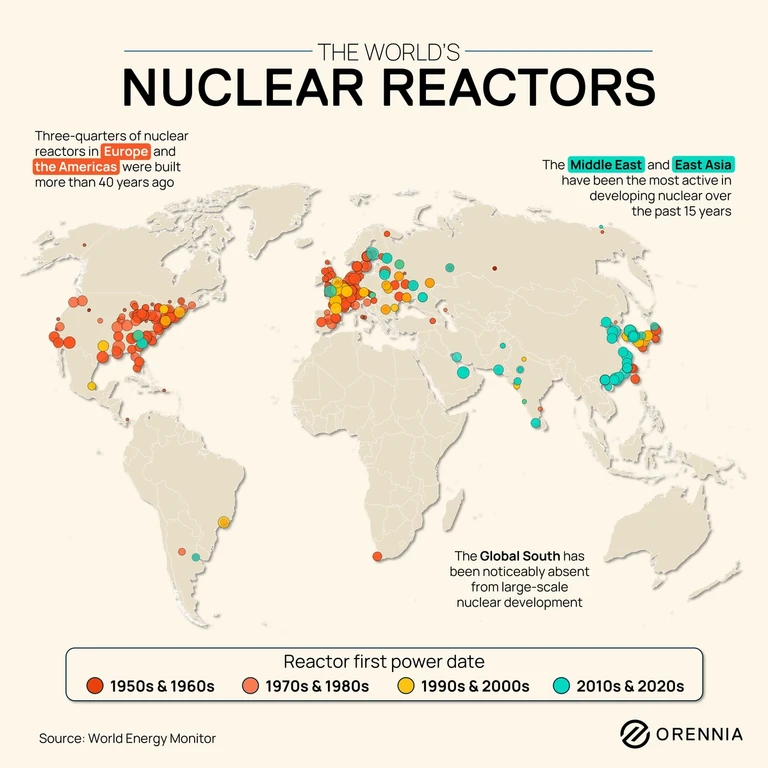
Historically dominated by the US, nuclear power generation has shifted to the East as concerns about energy security and power demand have grown.
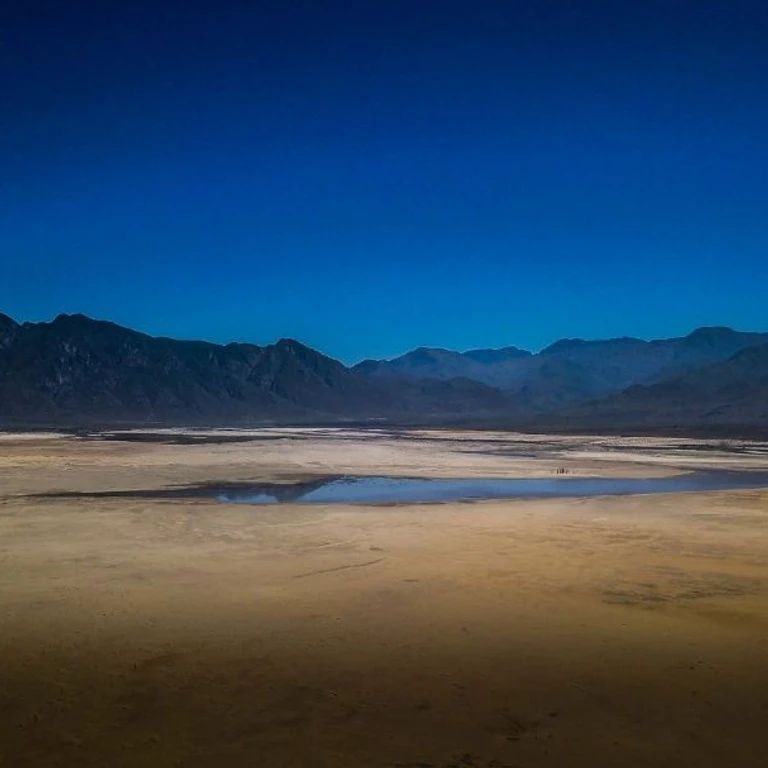
What happens when a major industrial city enters a prolonged drought and there’s not enough water to meet demand? Who gets their taps shut off first?
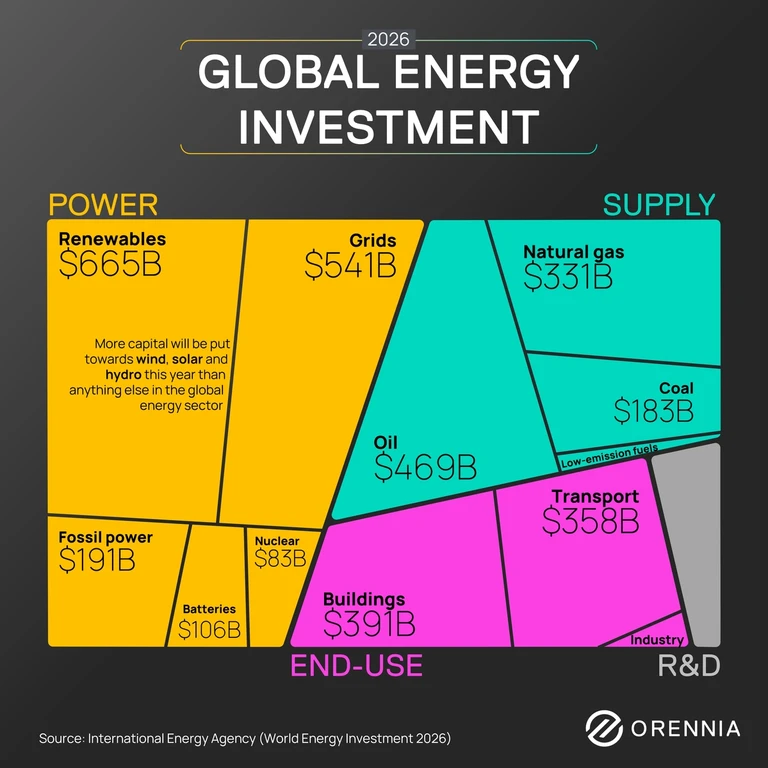
The World Energy Investment 2026 highlights the growing investments in electrification around the world.
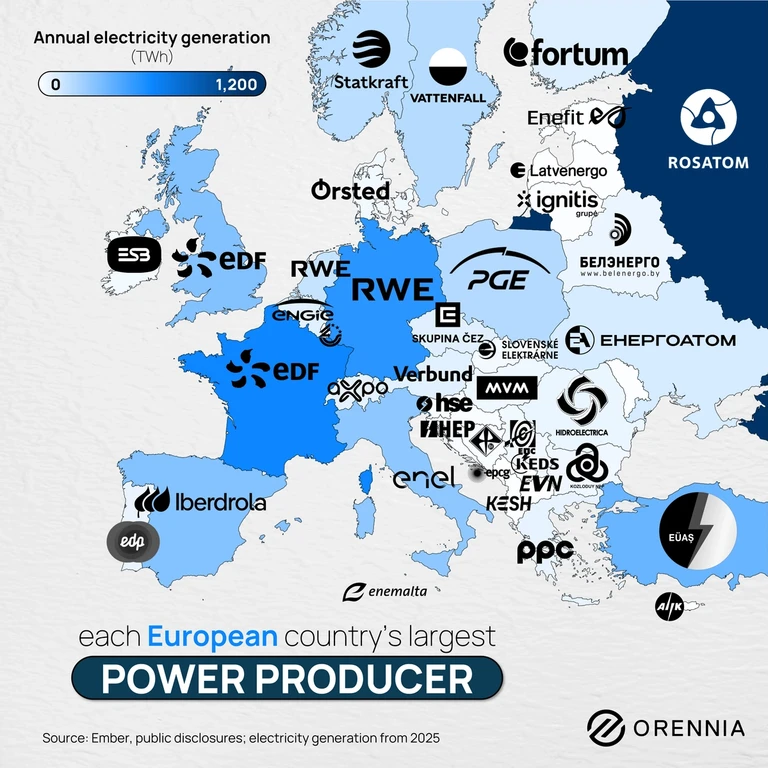
Europe’s electricity sector is dominated by a handful of large, often state backed utilities, which together operate a substantial share of the continent’s generating capacity.
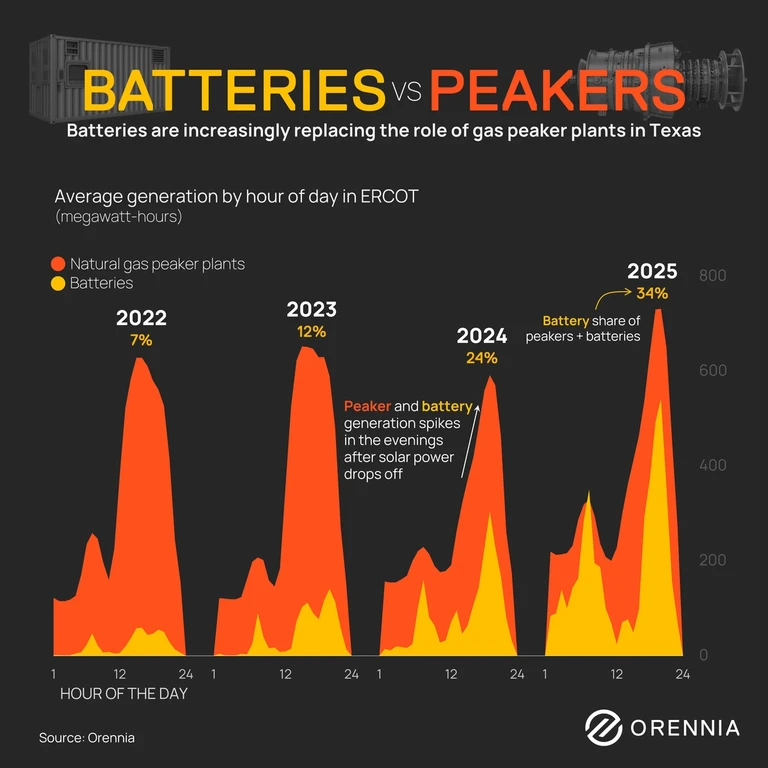
The grid that serves most of Texas is witnessing a shift as batteries are starting to displace peaker plants serving periods of higher load on the system.
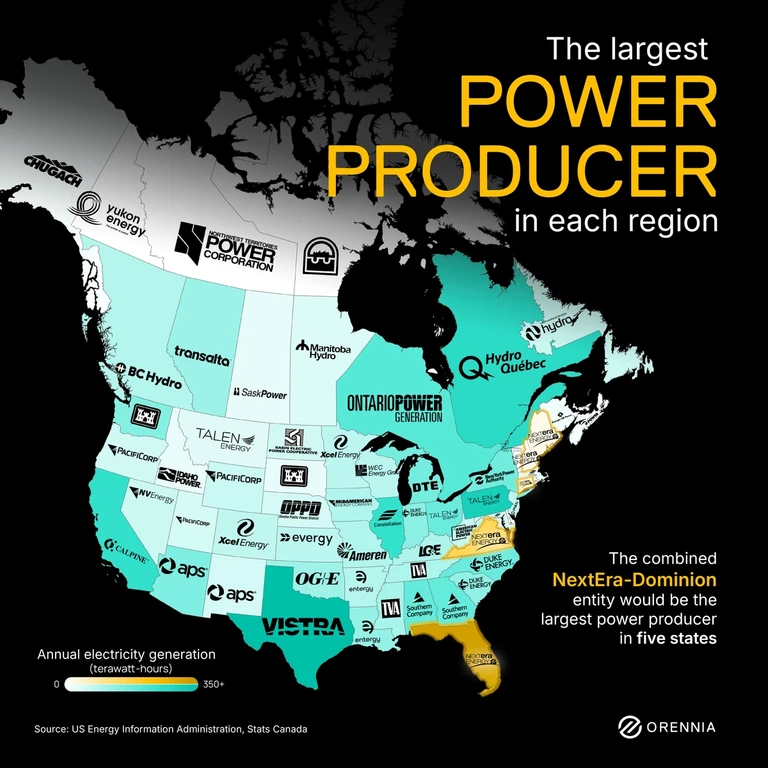
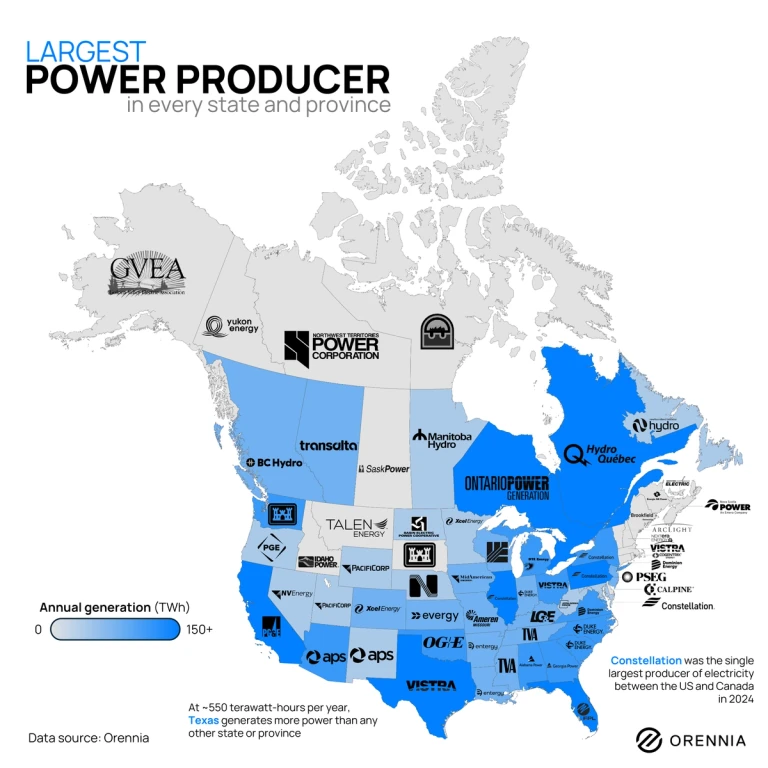
The largest electricity producers in North America by region, including Hydro‑Québec, Ontario Power Generation and NextEra Energy.
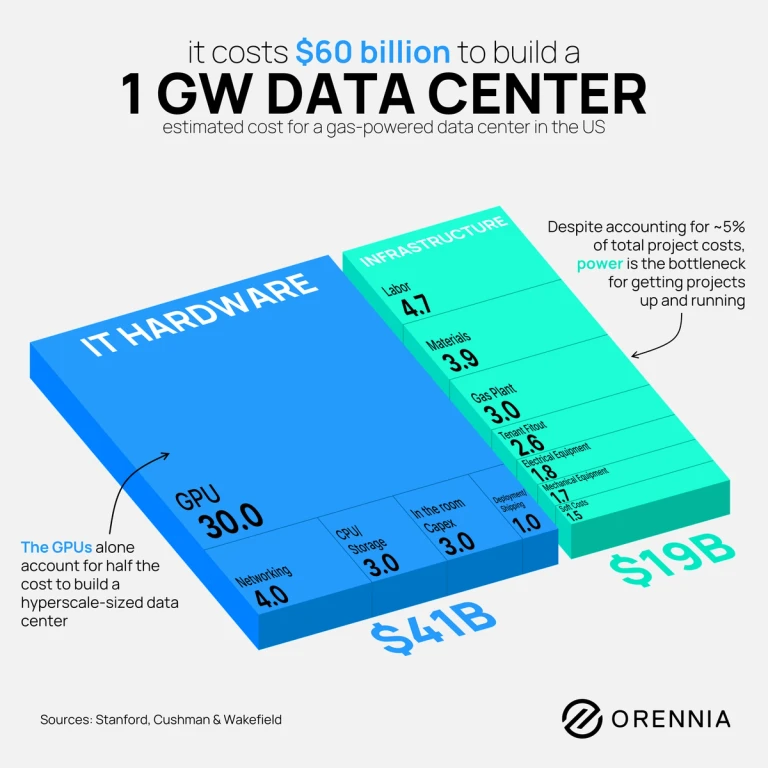
A 1 GW gas-powered data center runs about $60 billion with the split roughly 70/30 between IT hardware and physical infrastructure.

Explore why the Trump administration has forced a number of coal-fired plants to stay open.
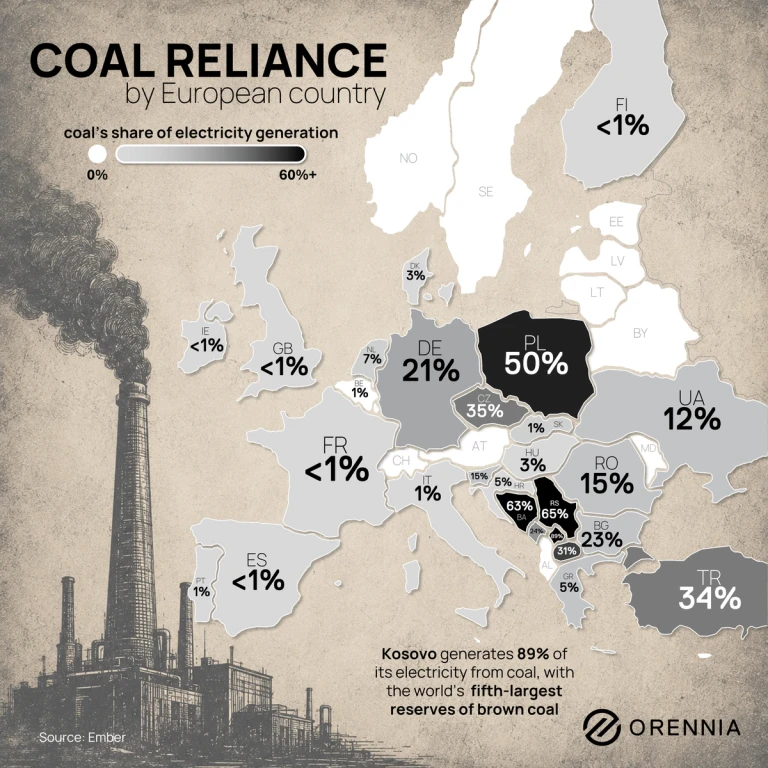
Europe's coal dependence is no longer widespread, it is concentrated in a handful of countries that now represent the last major strongholds of coal power on the continent.
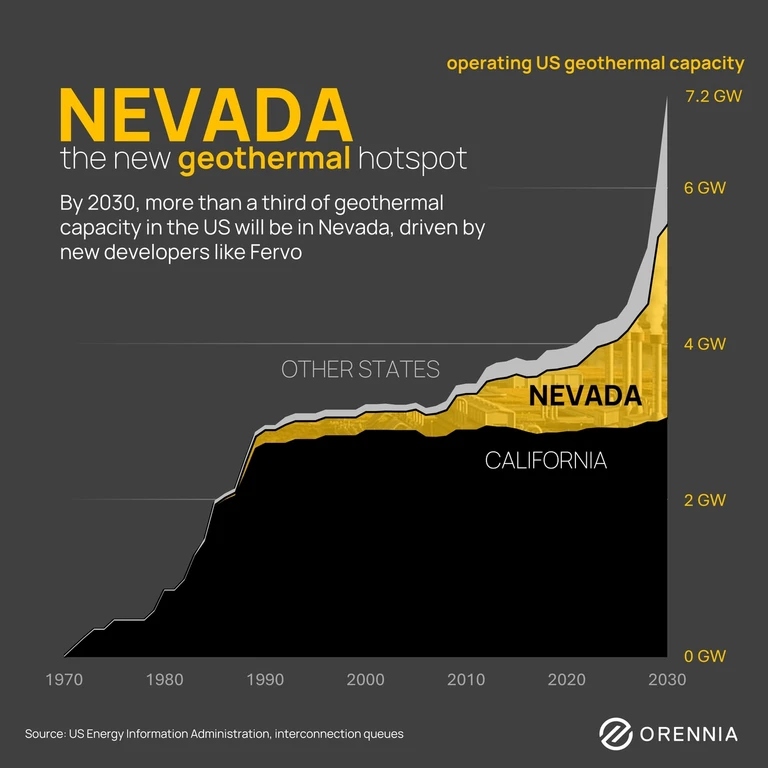
By 2030, more than a third of US geothermal capacity will be concentrated in Nevada.
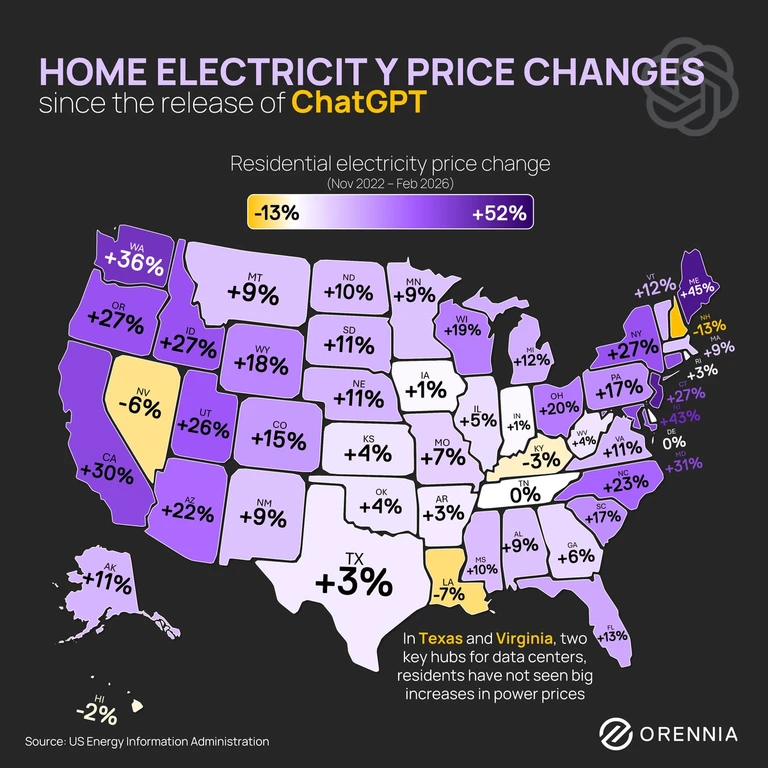
Regional power price increases in the US have increased since the launch of AI but it doesn't appear AI is the only factor making an impact.

Natural gas in North America is a fortress due to horizontal drilling and hydraulic fracturing.
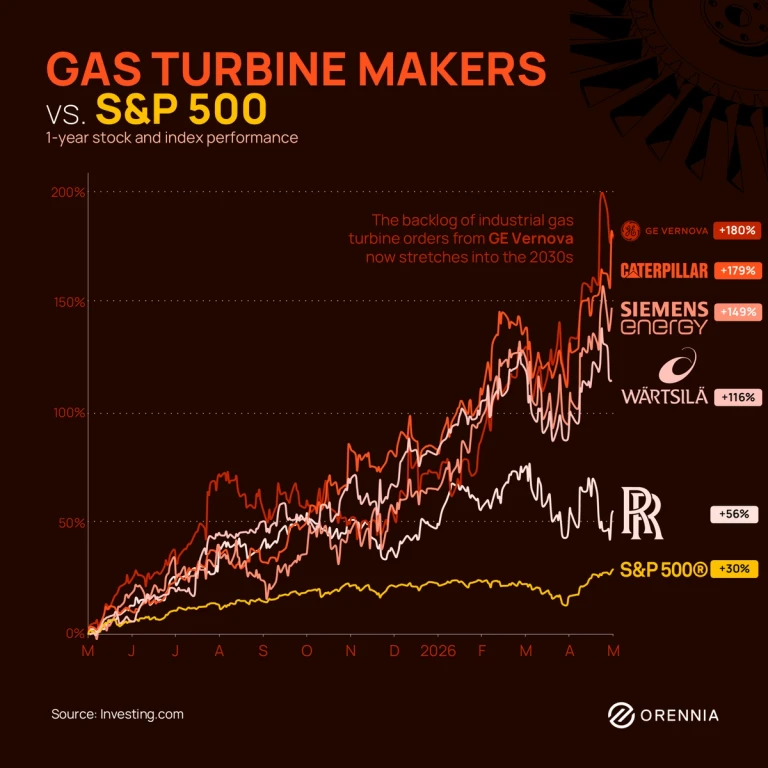
AI needs power and right now, the companies building the machines to generate that power are some of the best-performing stocks on the planet.
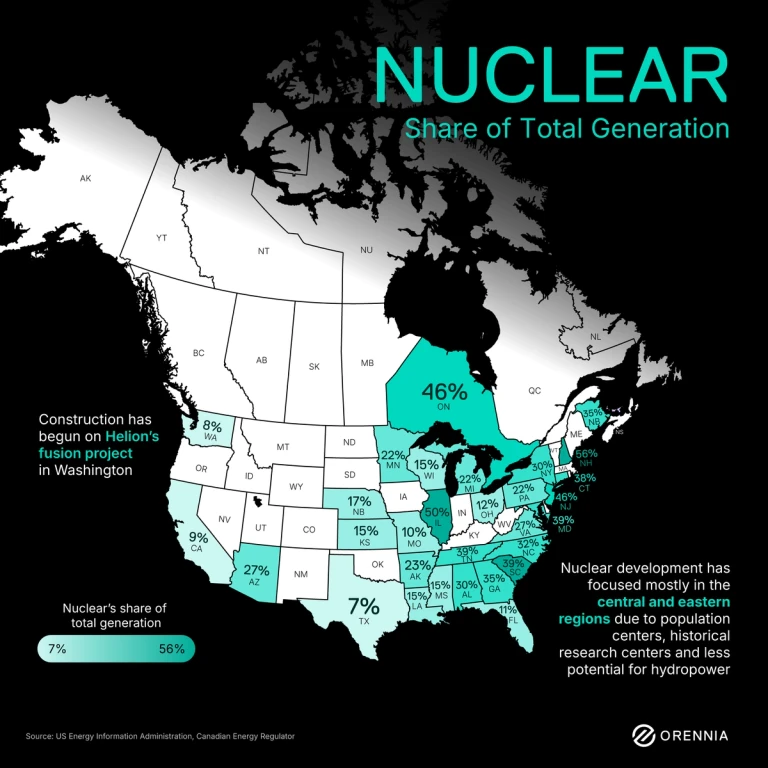
Take a look at nuclear power's share of total power generation in Canada and the US.
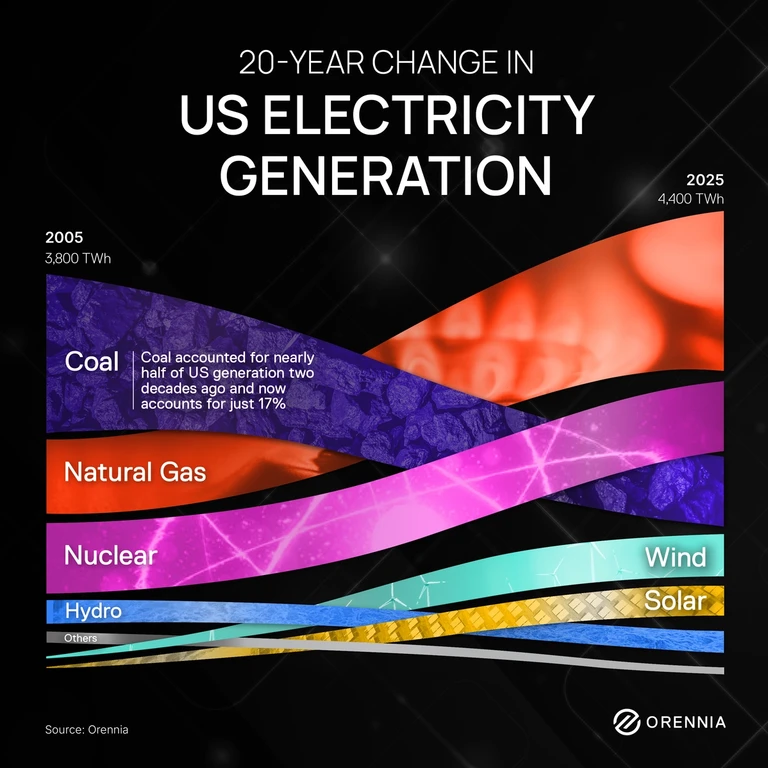
Two decades ago, coal generated half of all US electricity. Today, it generates less than a fifth. See how electricity has changed.
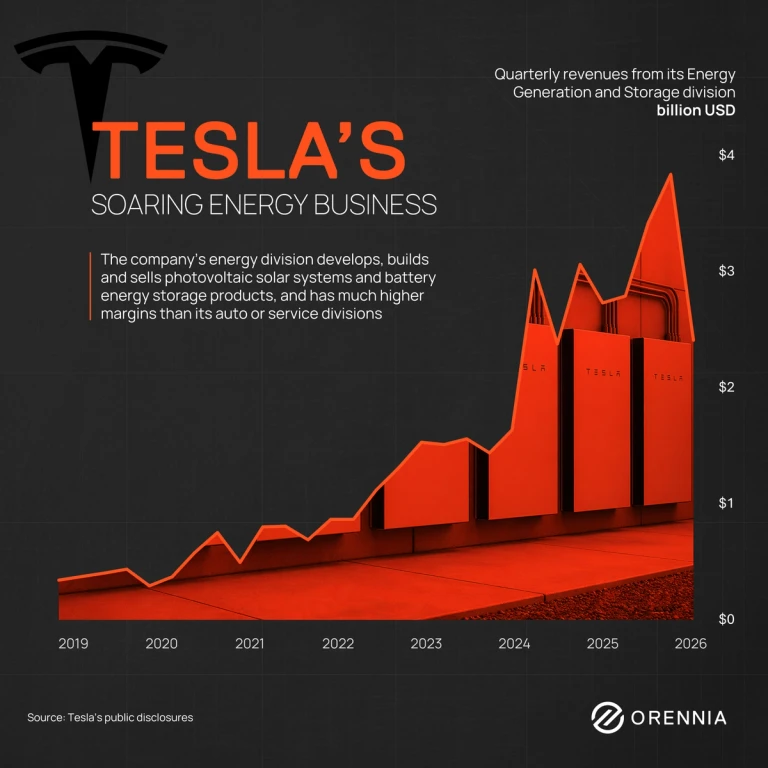
This chart shows how Tesla develops, builds and sells photovoltaic solar systems and battery energy storage products, to provide huge business growth.

This 38-page perspectives report from Shift Lab gives you a data-rich view of how electrification and clean energy manufacturing are reshaping energy security.
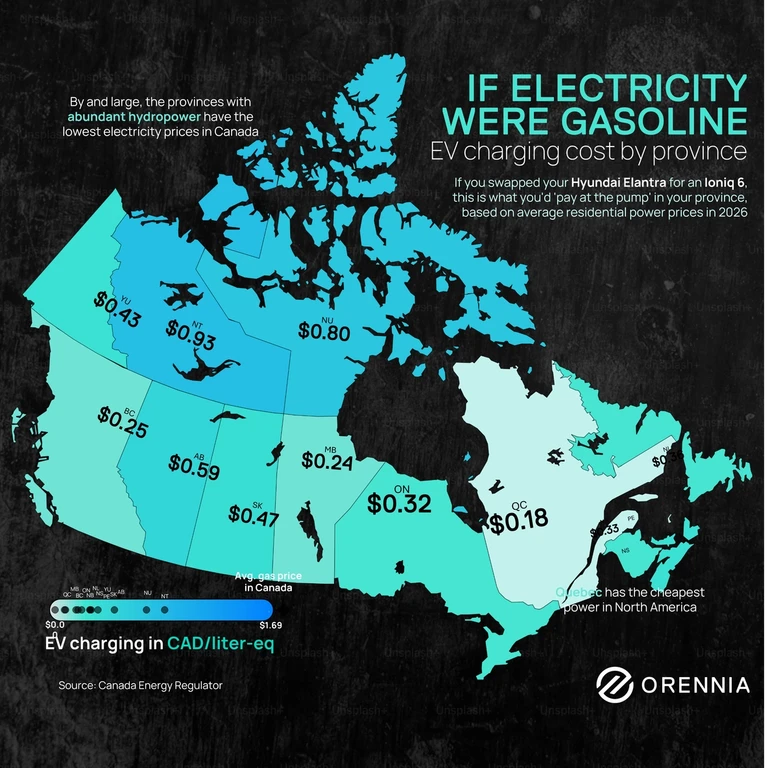
What if drivers charged their cars the same way they fueled it? What would that look like on a price-per-litre-equivalent basis?
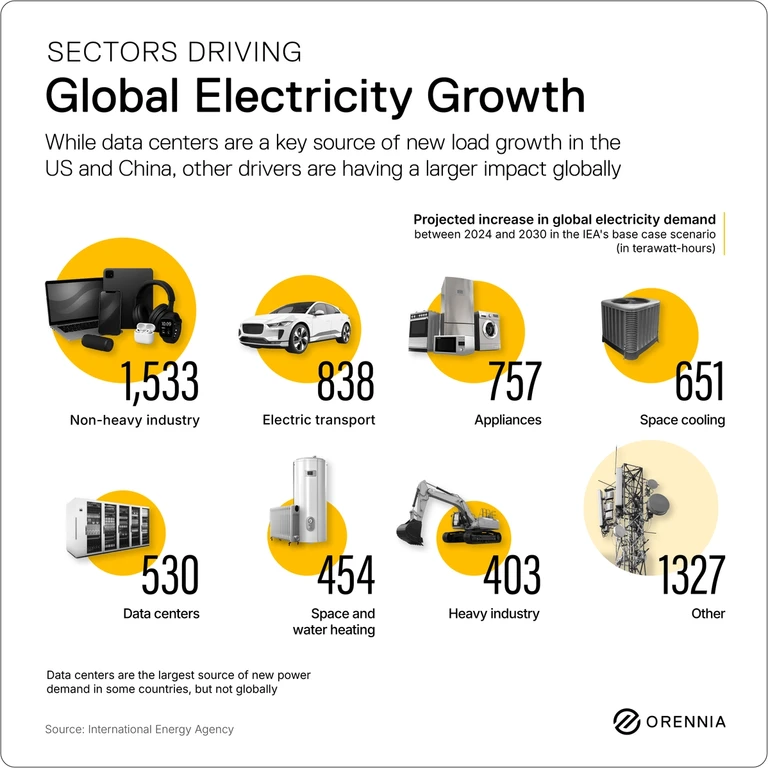
Data centers have altered the course of North American power demand but account for less than 10% of projected new demand.
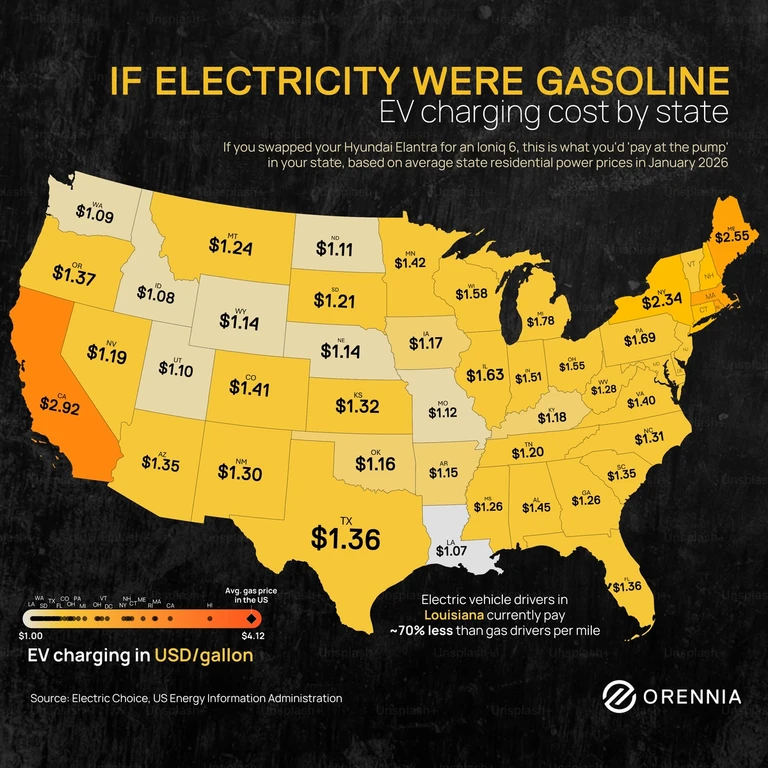
The Iran war's oil price shock has reignited consumer interest in EVs, with dealerships in high-gas states reporting a surge in Ioniq 6 and Model 3 inquiries not seen since the 2022 price spike.

Japanese monks kept meticulous records of cherry blossom festivals for 1,200 years and accidentally created the longest climate dataset on Earth.

It’s widely expected that, by the end of the decade, quantum computers will reach a level of maturity that they’ll start meaningfully contributing to a major commercial breakthrough and spur interest in the technology the way ChatGPT sparked interest and billions of investments into artificial intelligence.
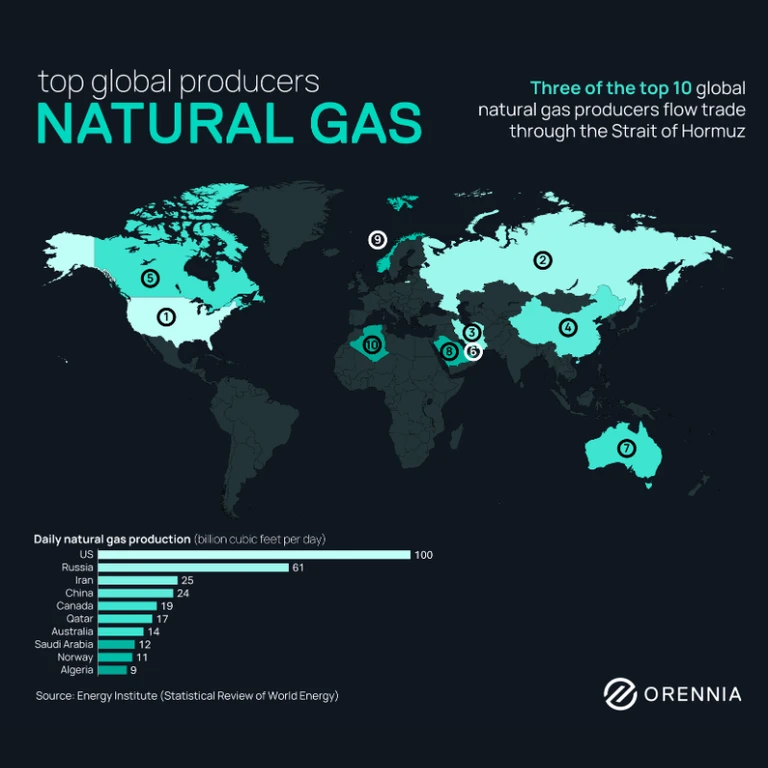
A small number of countries control most natural gas, with the United States, Russia, Iran and China supplying more than half of world production.

You may have heard the theory about the substation near the 49ers practice facility and the apparent link to the team's injury rates. For those of us who spend our working hours focused on power infrastructure, we had to know the truth.
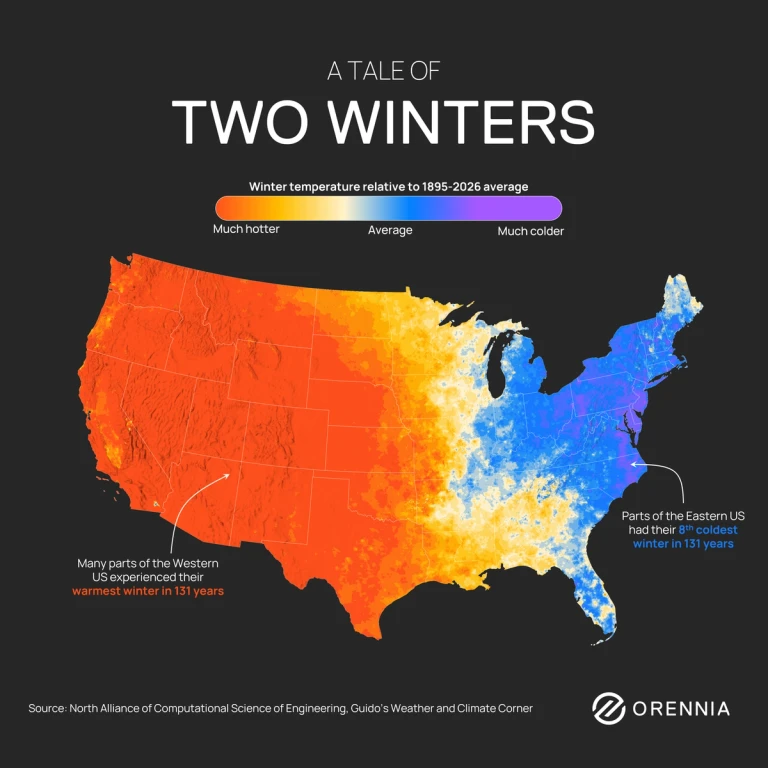
Map showing US winter temperature anomalies, with the Western United States experiencing record warmth and the Eastern United States experiencing record cold relative to the 1895–2026 average.

Has Cuba inadvertently become one of the most compelling case studies on how energy sustainability is now energy security?
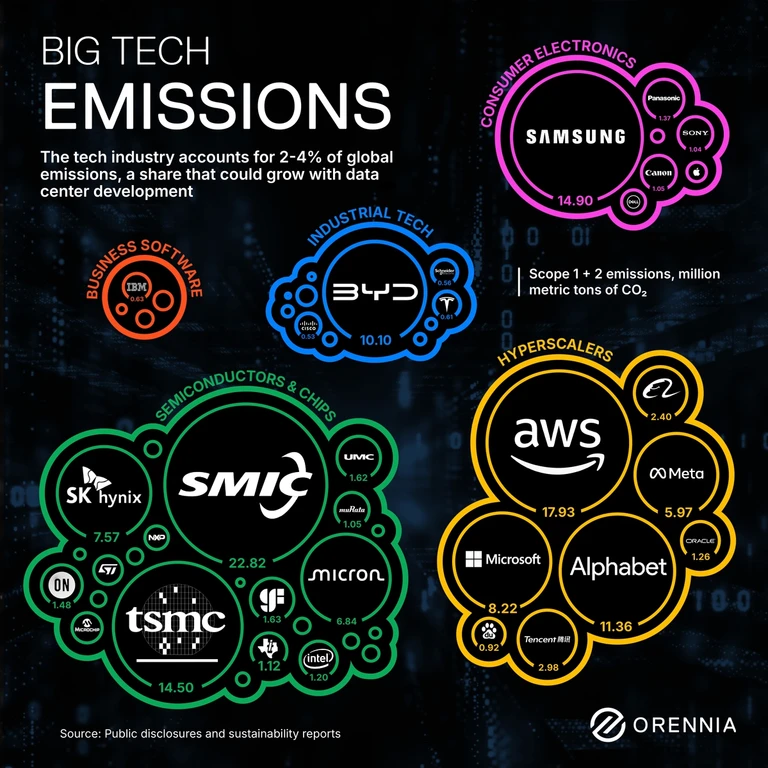
How much do big tech companies contribute to global emissions?
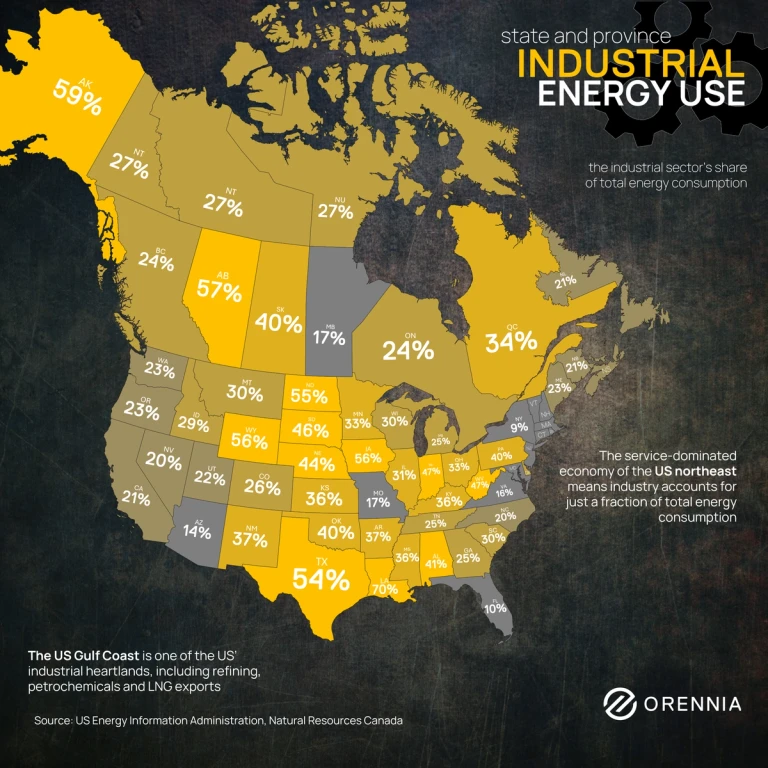
Map of industry's share of total energy consumption by state and province across North America, highlights how unevenly industrial activity is distributed.
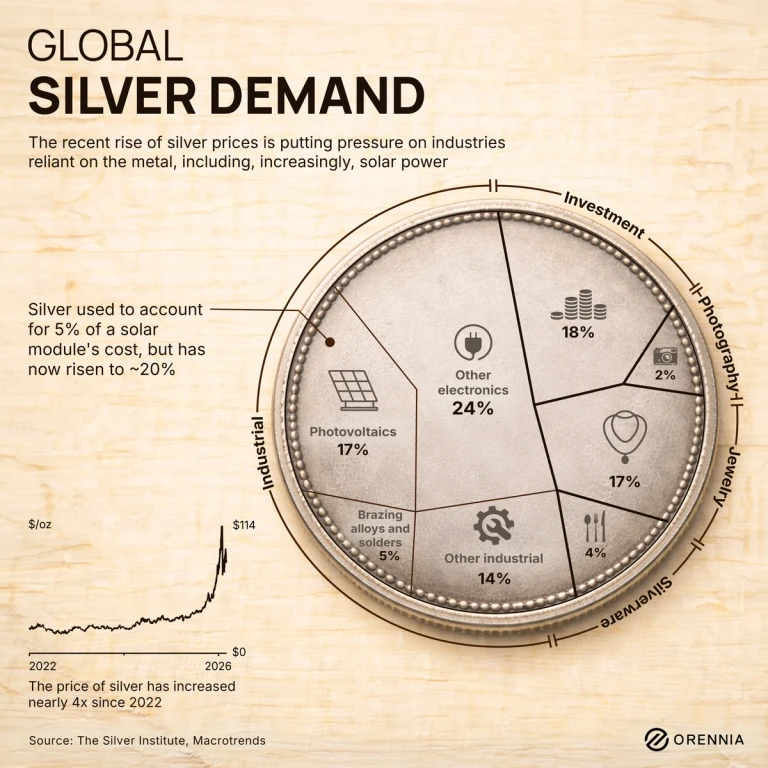
Silver used to account for 5% of a solar module's cost, but has now risen to ~20% of the cost.
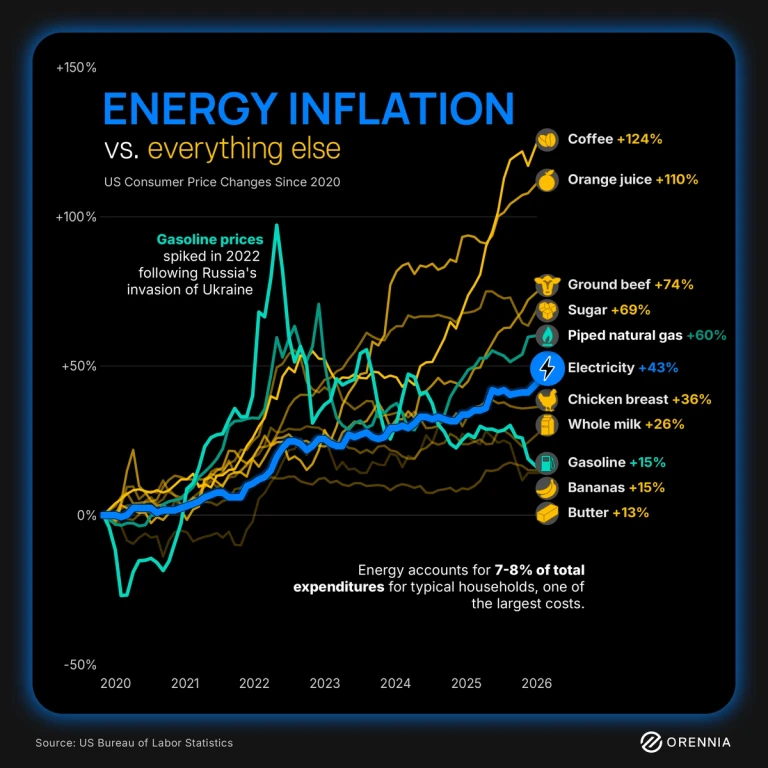
Since 2020, consumer prices for energy items like electricity, natural gas and gasoline all rose in the US but several everyday goods climbed even faster.

AI is making weather forecasts better and since renewables are so weather dependent, there are cost impacts to the power grid.
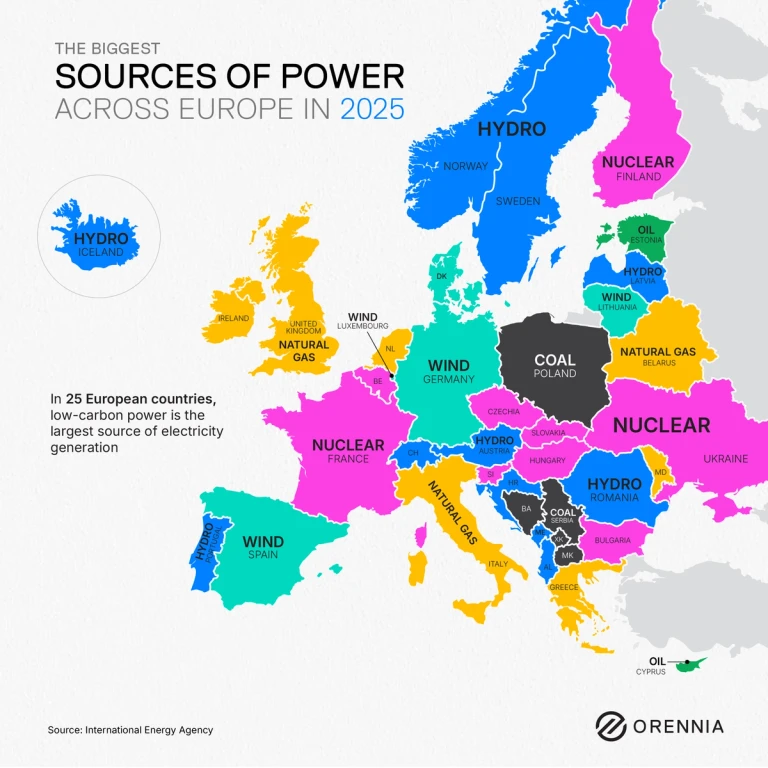
What was the biggest source of power across Europe in 2025?

With fuels sold abroad, many power technologies manufactured overseas and a focus on consumer prices, how will a weaker US dollar impact the energy industry?
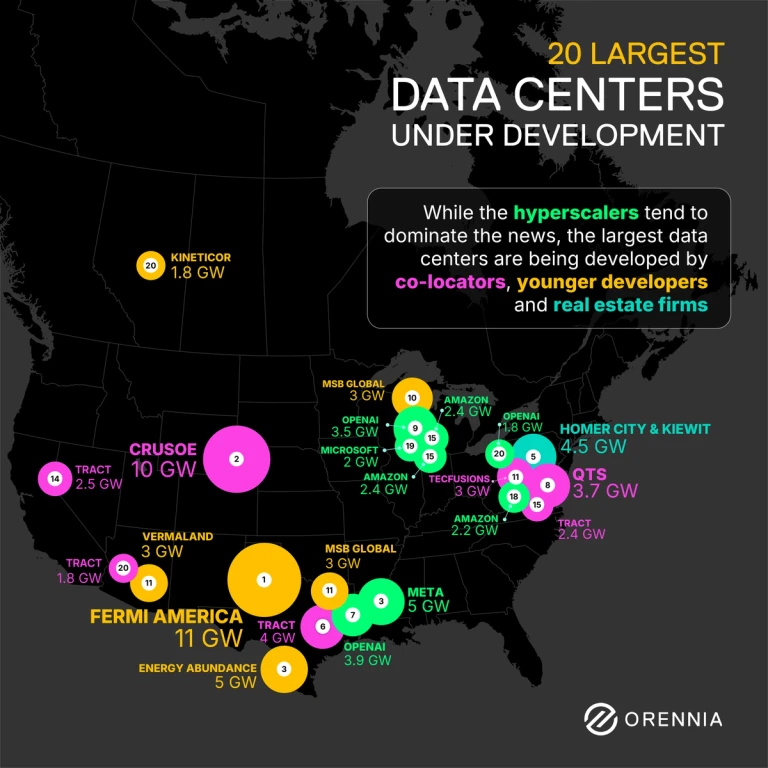
See the 20 largest data centers under development in North America. The map outlines planned gigawatt capacity by company and location.
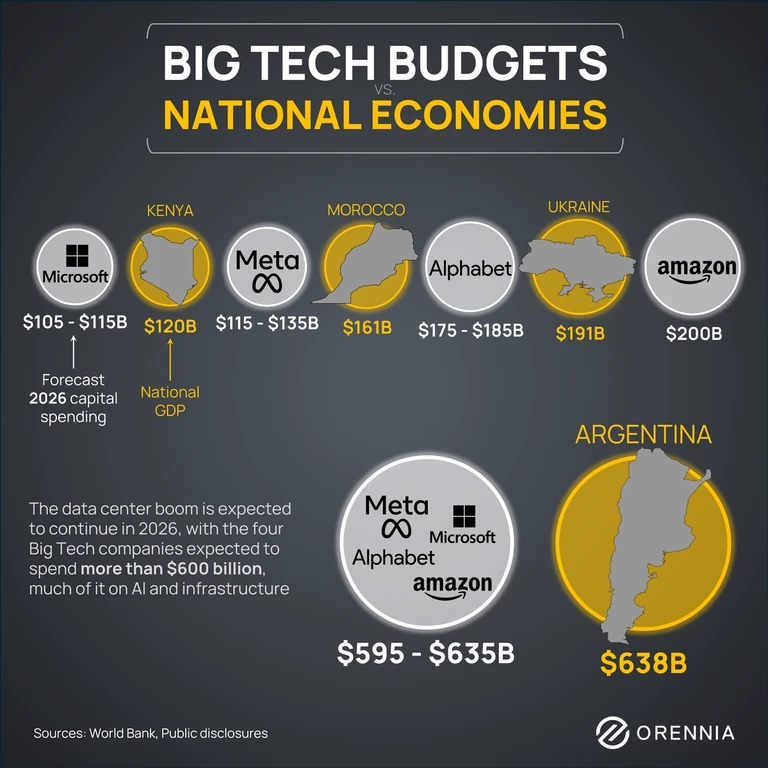
Infographic comparing forecasted 2026 Big Tech capital spending with national GDP figures for countries including Kenya, Morocco, Ukraine, and Argentina.
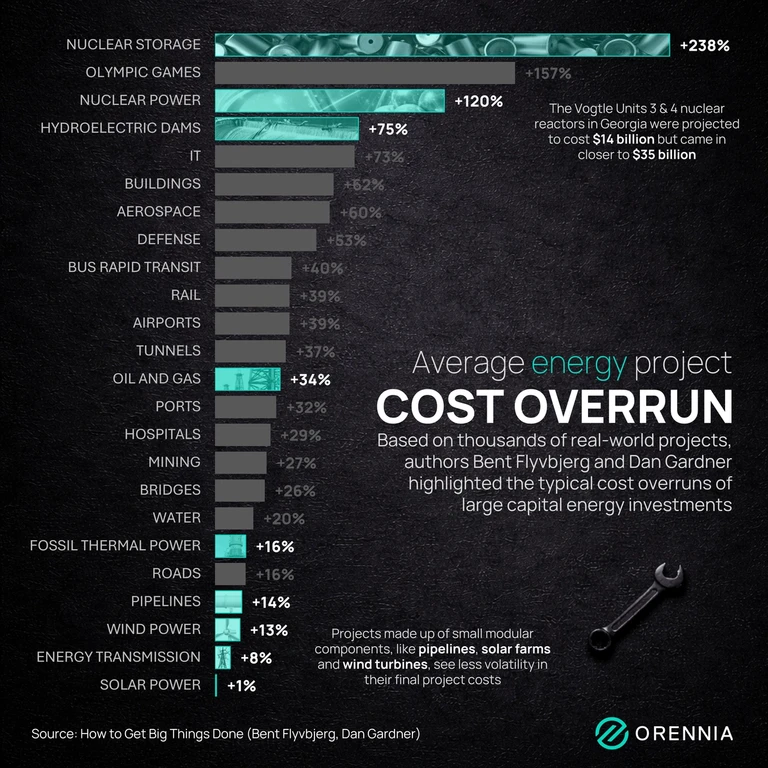
Based on thousands of real-world projects, authors Bent Flyvbjerg and Dan Gardner highlighted the typical cost overruns of large capital energy investments.
Fervo, a Houston-based geothermal company that just came off a huge Series E in December, has quietly filed for its IPO and is getting ready to turn on its flagship power project.
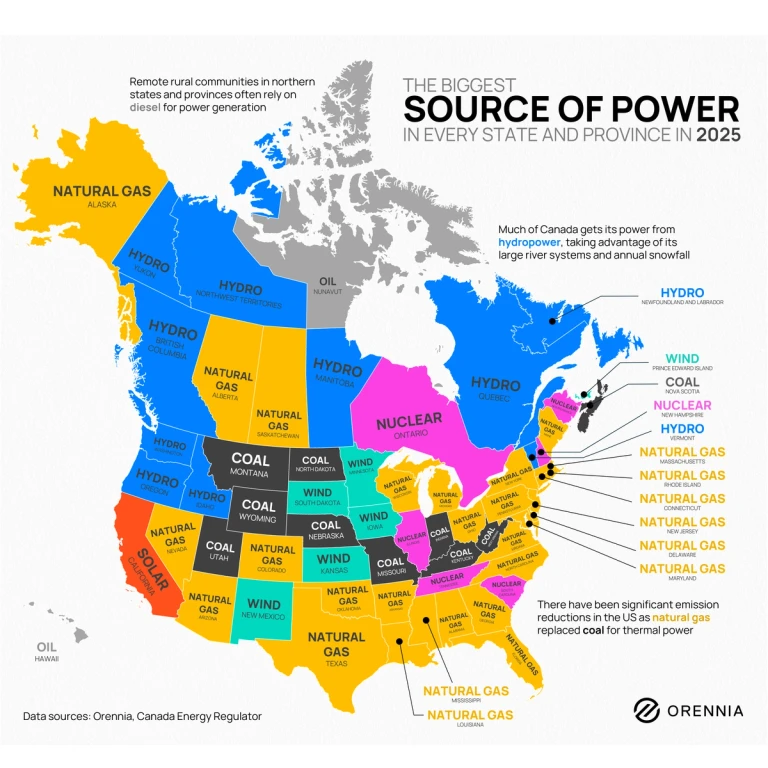
What was the biggest source of power in every state and province in 2025?

Take a look at what progress has been made on Project 2025 energy sector policy recommendations to shed light on what we might expect to see in 2026.

Get a full recap of 2025 and gain valuable insights for 2026 with our 150+ page report on what's shaping the energy transition.

2025 will go down in the history books as anything but unremarkable. Here are the eight charts that define what happened this past year.

Hear from the experts at Orennia on the state of the transition and the new energy landscape.

Hear from Orennia and Intertek CEA (formerly Clean Energy Associates) experts as they discuss the outlook on trends and FEOC elements affecting storage.

Amid surging power demand from AI-driven data centers, the US is witnessing an unexpected thermal revival. As developers race to secure reliable multi-gigawatt solutions, unconventional approaches are reshaping how America keeps pace with unprecedented load growth.
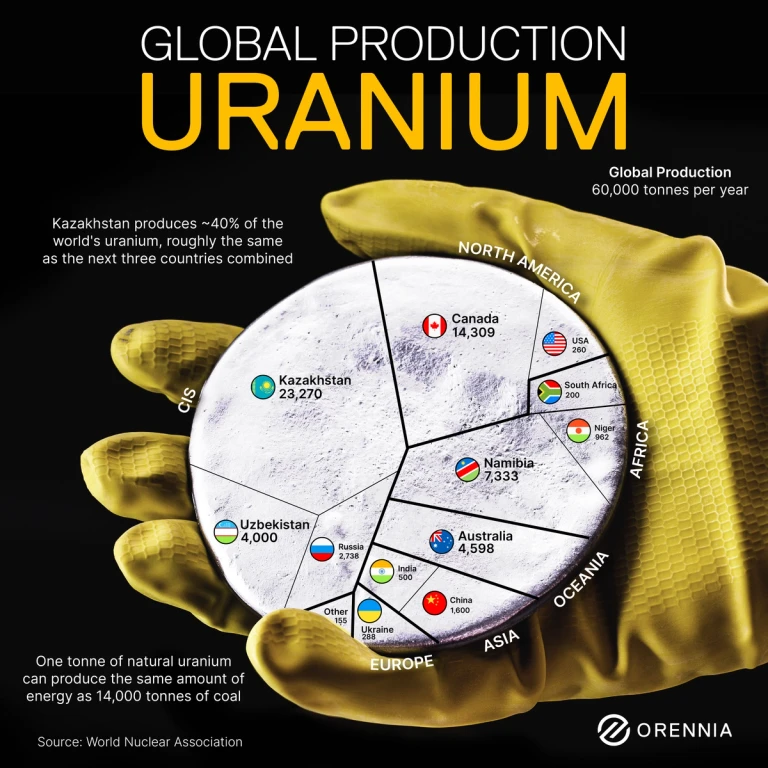
Today, nearly 60,000 tonnes of uranium are produced annually, with most of it originating from Central Asia, North America and southern Africa.

Can banker-turned-politician Mark Carney and his revitalized Liberal Party get Canada back on track?
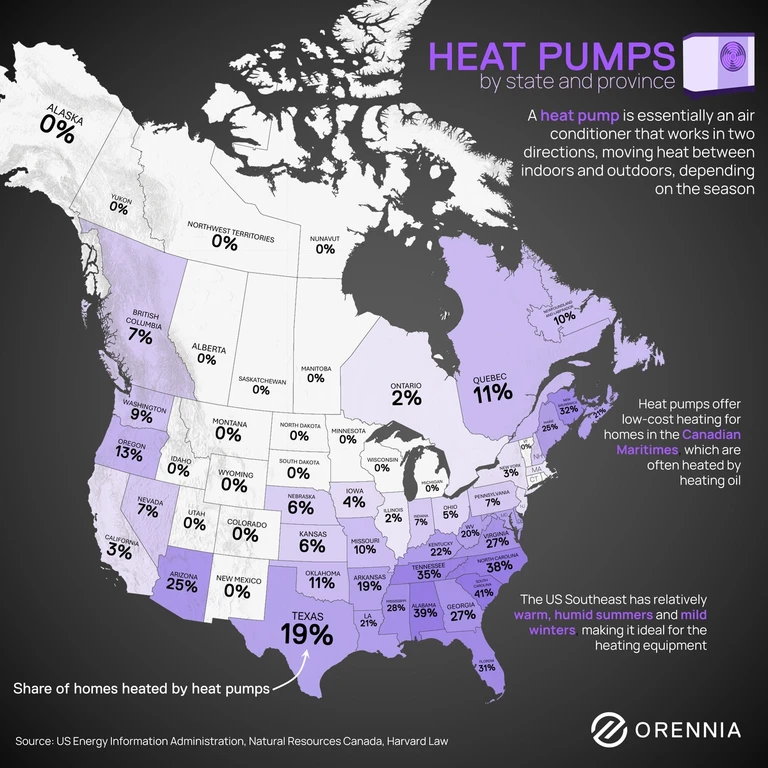
See heat pump adoption by state and province across North America, with highest usage in the U.S. Southeast and Canadian Maritimes.
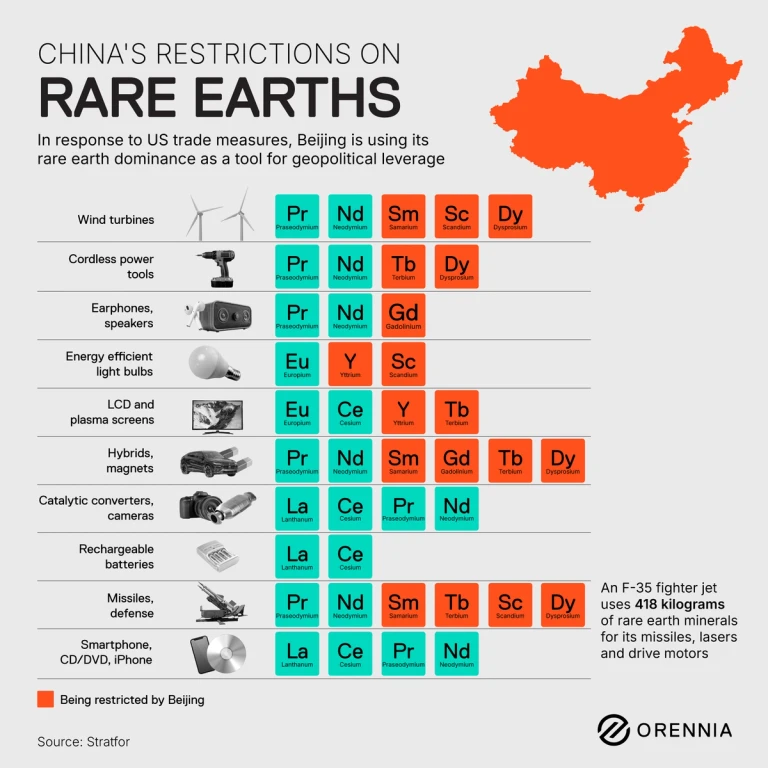
Beijing has tightened export controls on a range of rare earth elements, using its near-monopoly on these critical minerals as leverage in response to US trade and technology restrictions.
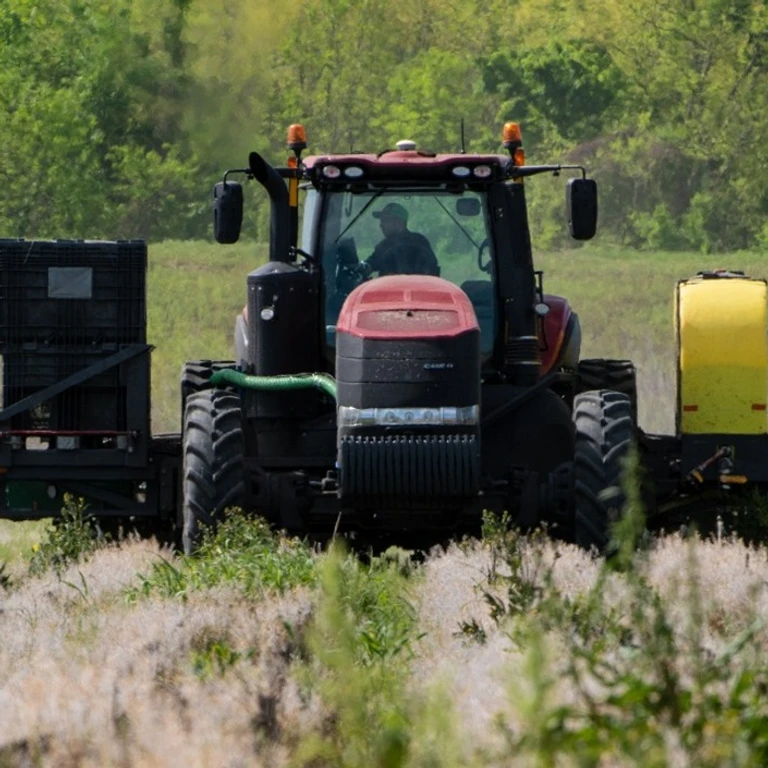
To provide relief for being collateral damage from the trade war with China, the White House is considering a $10 to $14 billion bailout for soybean farmers.
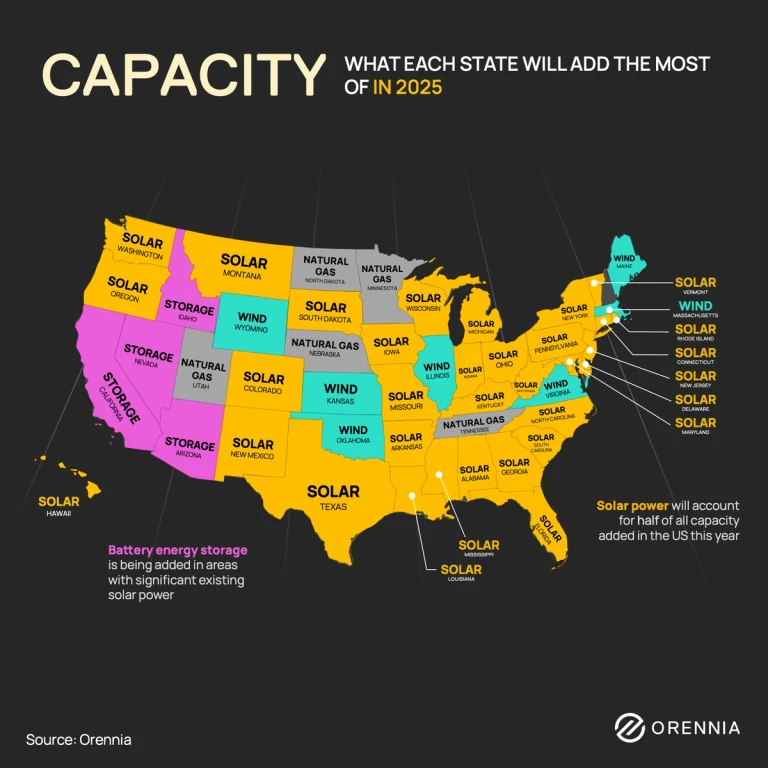
Orennia’s analysis shows solar will account for half of all new US capacity in 2025, with storage growing fast in solar-heavy areas.
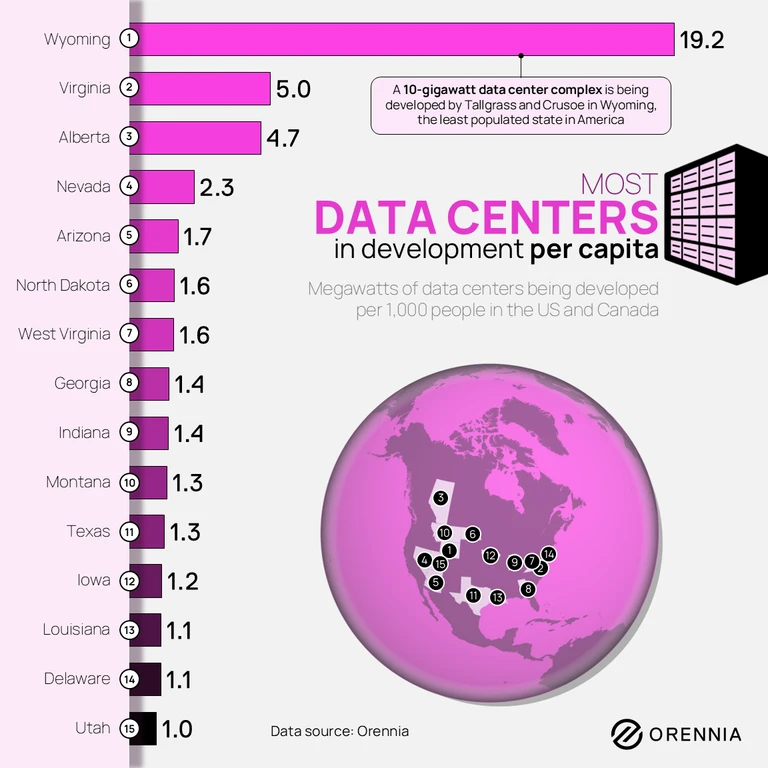
Discover the hidden hotspots of AI power demand hot spots across the United States and Canada. Our infographic highlights data centers in development per capita.

Can China turn renewable energy into its own geopolitical hammer with an electric alternative to the petrodollar?
There have been a number of technological and commercial breakthroughs in nuclear fusion but how realistic is fusion generated electricity?
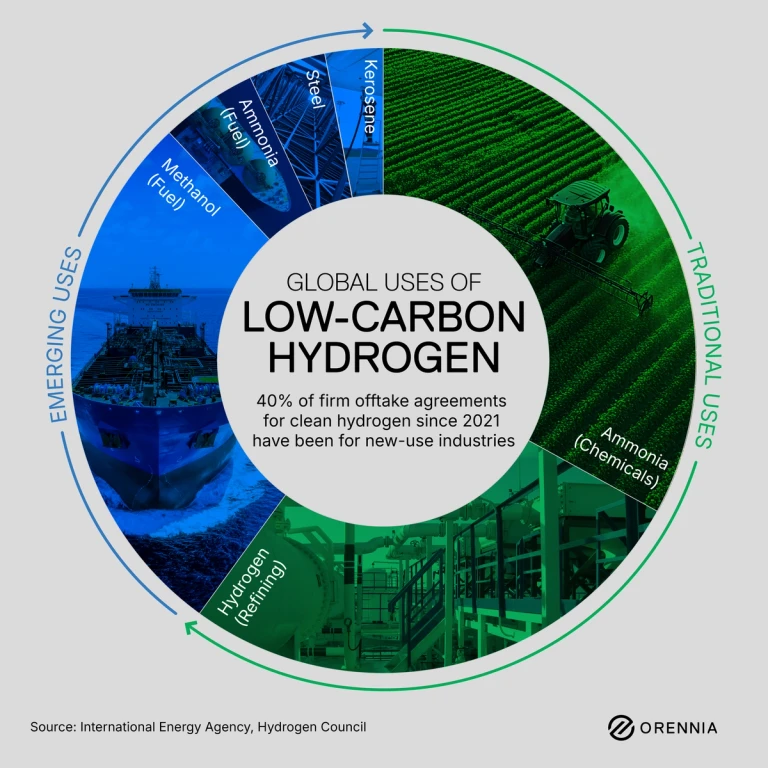
Take a look at global low-carbon hydrogen uses. 40% of firm offtake agreements for clean hydrogen since 2021 have been for new-use industries.

This article takes a look at what we know about sulfur dioxide and what it tells us about where we’re at with climate change.
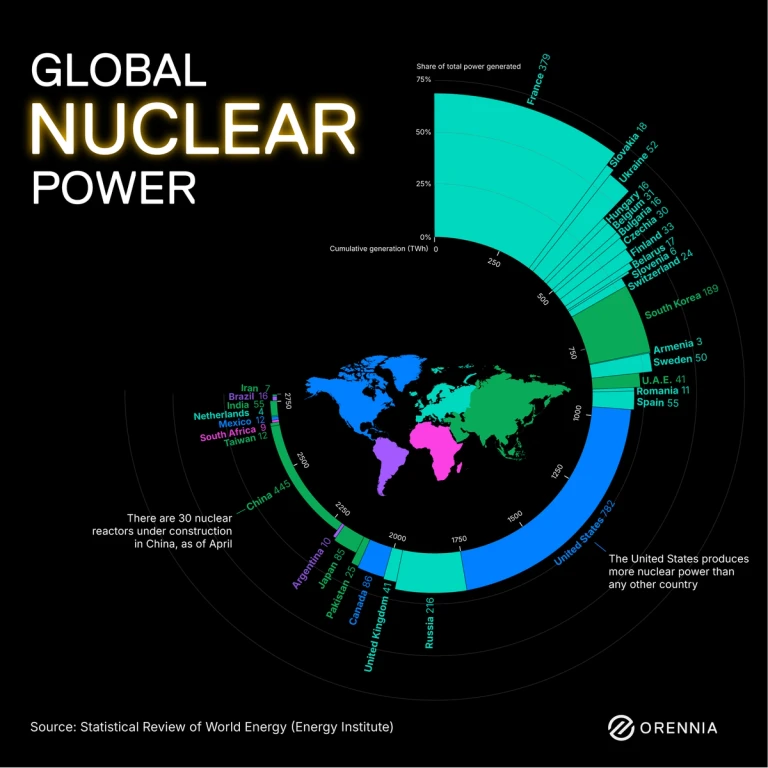
Who’s producing nuclear power, who’s just getting started and who’s not interested? This infographic charts each country’s share of nuclear electricity.
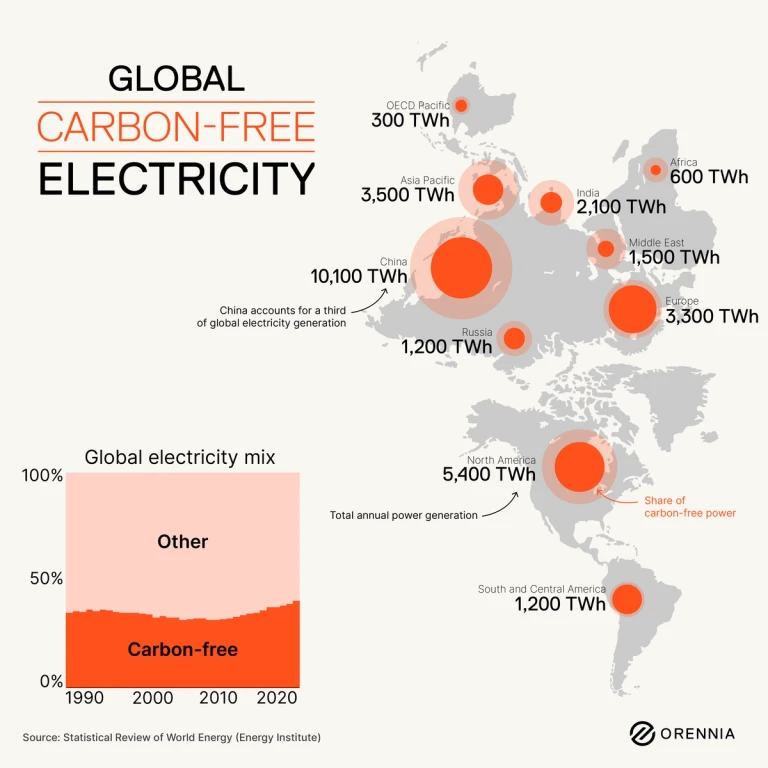
Clean power continues to expand at a rapid pace across the world. Take a look at the continued expansion of global carbon-free power.
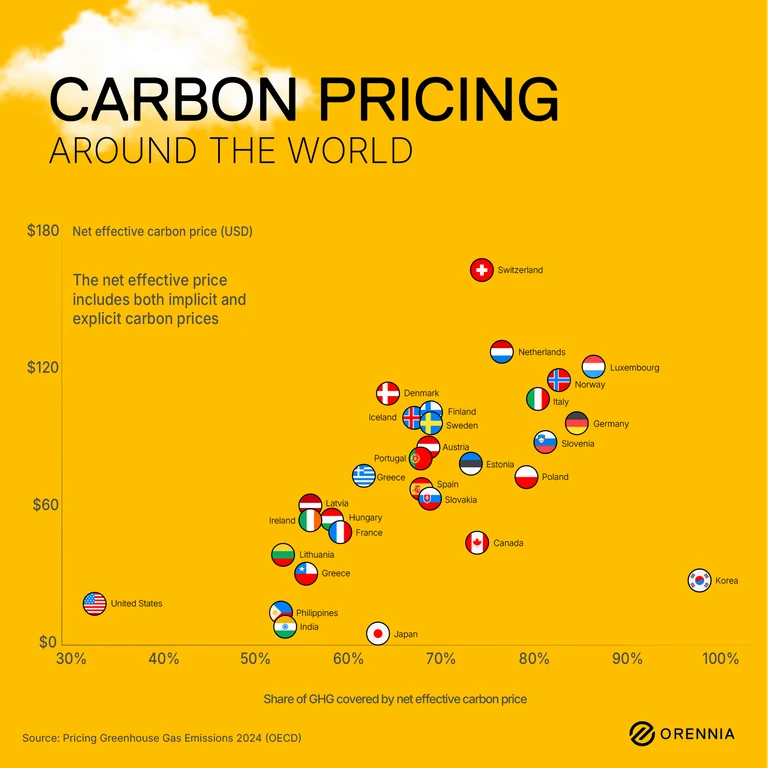
A price on carbon remains a widely used financial tool for governments to curb greenhouse gas emissions. This infographic explores carbon pricing around the world.
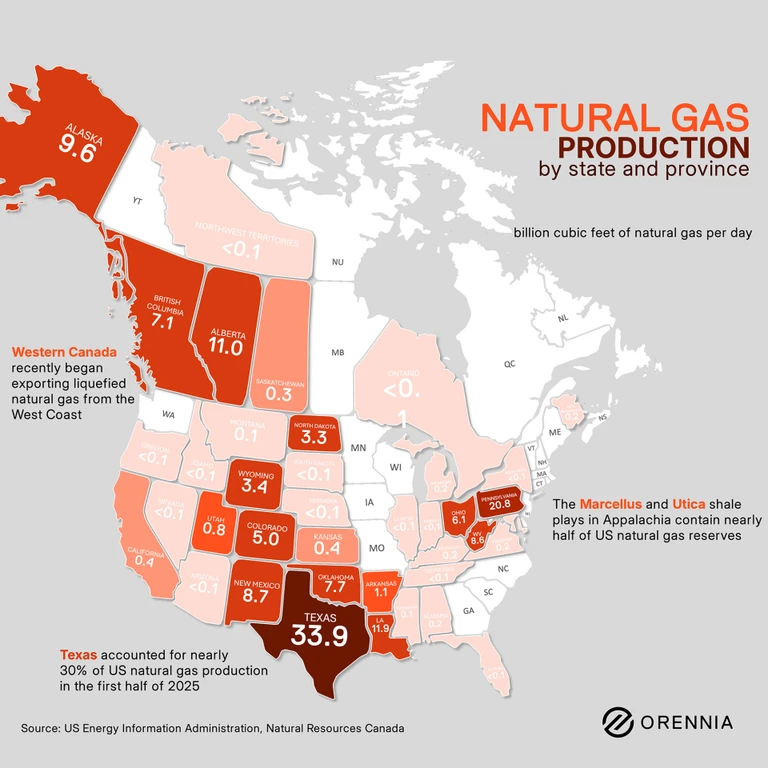
It’s expected that natural gas will play a significant role in addressing the near-term needs of data centers for power supply. Take a look at production in North America by state and province.
Can Alberta’s benefits outweigh recent actions from the provincial government to attract data centers?
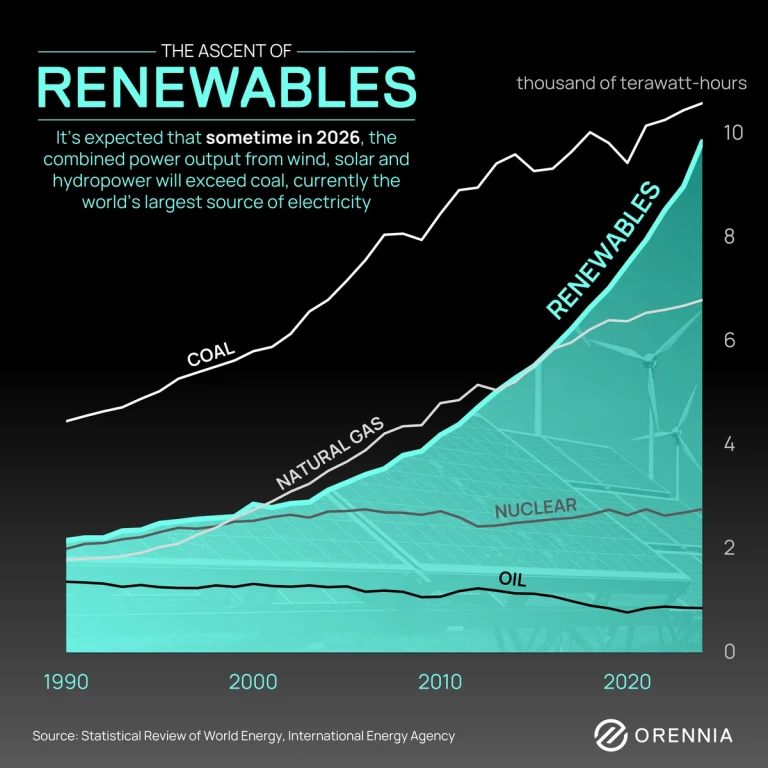
According to the latest International Energy Agency forecasts, renewables are poised to overtake coal as the world's top electricity source by 2025 or 2026 at the latest.
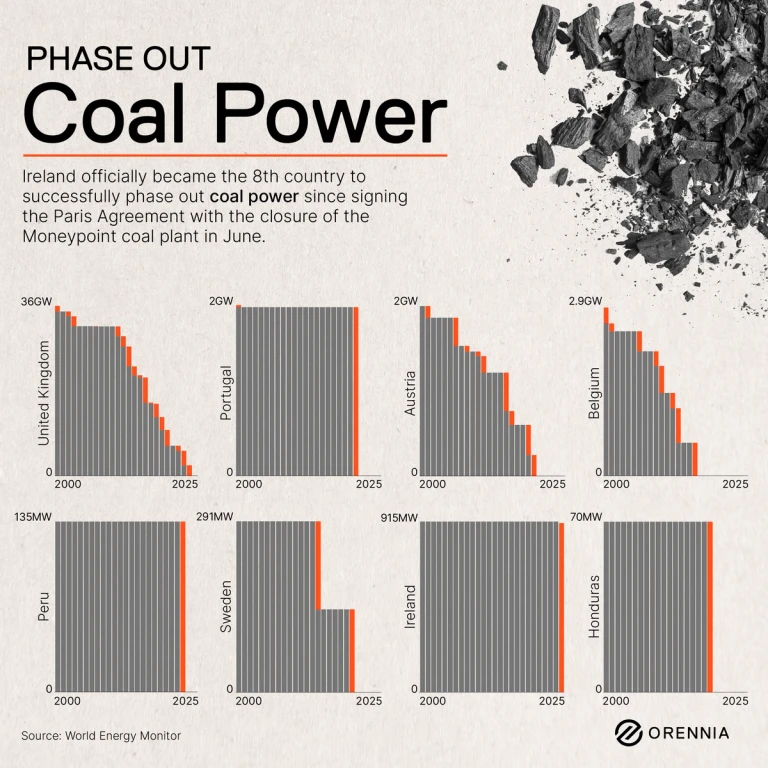
Once the backbone of industrial economies, coal is now being retired for cleaner, cheaper, and more sustainable energy sources. See the leaders in phasing out coal.
How much was the Grain Belt Express’s cancelled loan the act of an administration with a vendetta against wind power?

What will the impact of autonomous vehicles be on the power sector? Let’s buckle up and find out.
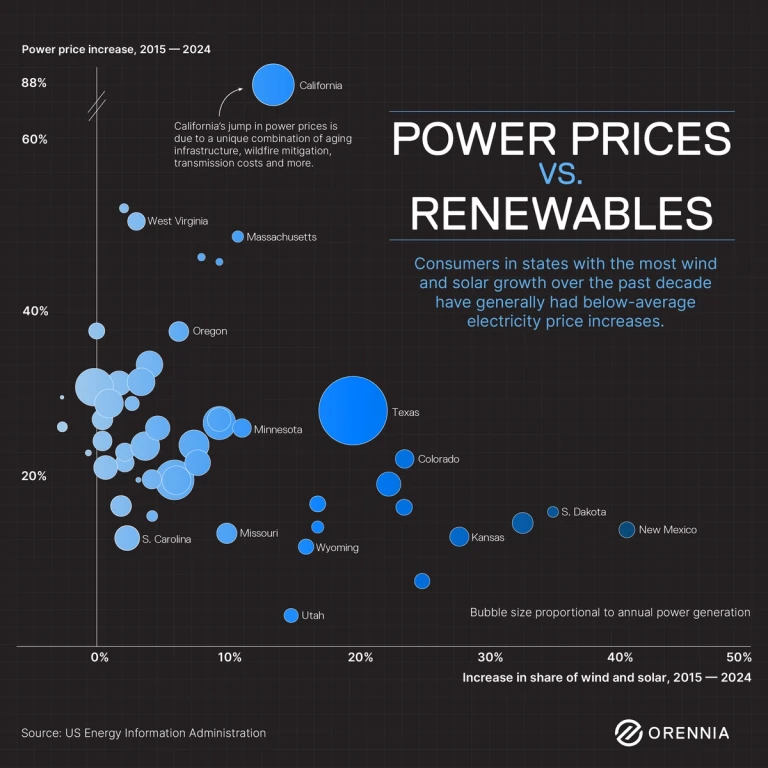
Pundits regularly argue that the rise of renewable energy is driving up electricity prices. But the data tells a different story.
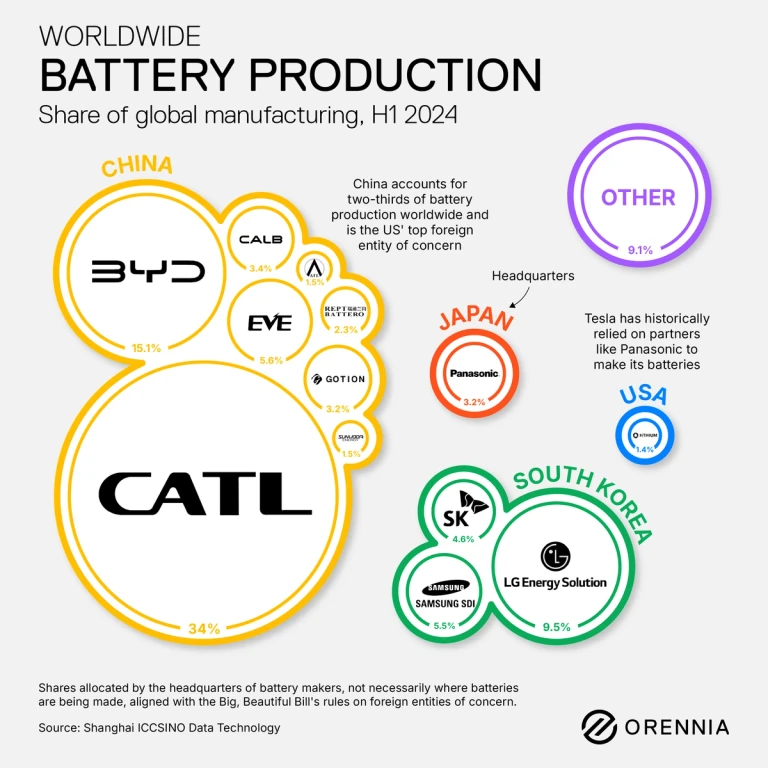
The Big Beautiful Bill Act did not undercut support for batteries, as many had initially feared in the early drafts of the bill, but its provisions come with geopolitical strings attached.

Sometime in the middle of last year, BYD did the unthinkable: it overtook Tesla in global electric vehicle sales. For many on the outside, it wasn’t supposed to play out this way.

Hear from Aaron Foyer and Spencer O'Donnell as they discuss the current state of the transition and targeted, data-informed strategies to shape the road ahead.

Tariffs on copper are likely to impact energy prices. Learn more about America's copper supply.
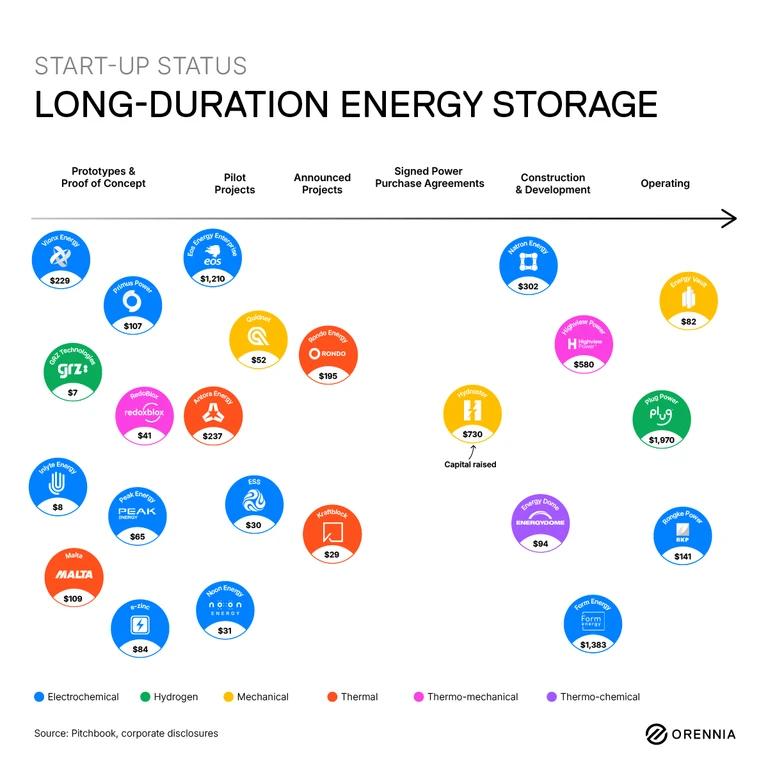
There is a need to develop long term energy storage (LDES) to affordably store energy for days to weeks. Explore the types of storage technologies being developed.
Can advanced nuclear reactors, with their need for more highly enriched uranium, find success in an increasingly polarized and fractured geopolitical world hostile to upgrading uranium?

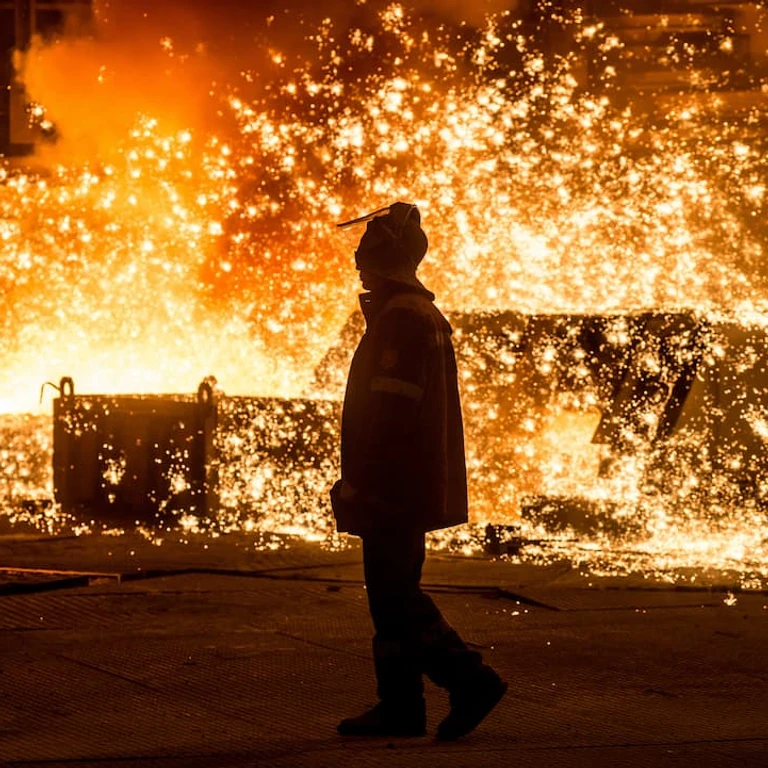
For consumers of steel, including energy companies, the tariffs complicate supply chains and drive-up projects costs for both clean and conventional energy. This article takes a look at the impact of steel tariffs.
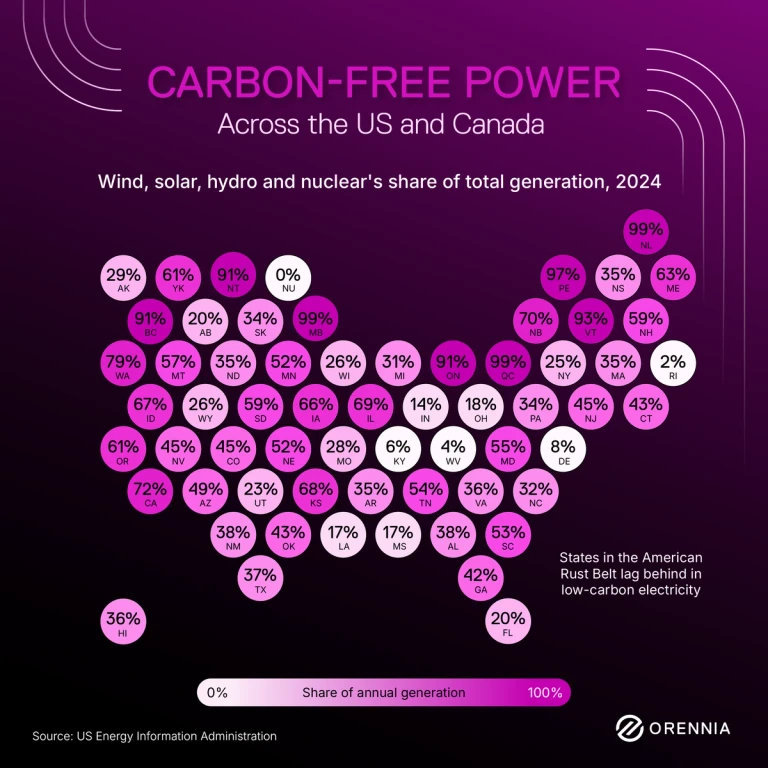
North America is home to some of the most diverse low-carbon power portfolios in the world. Have a look.
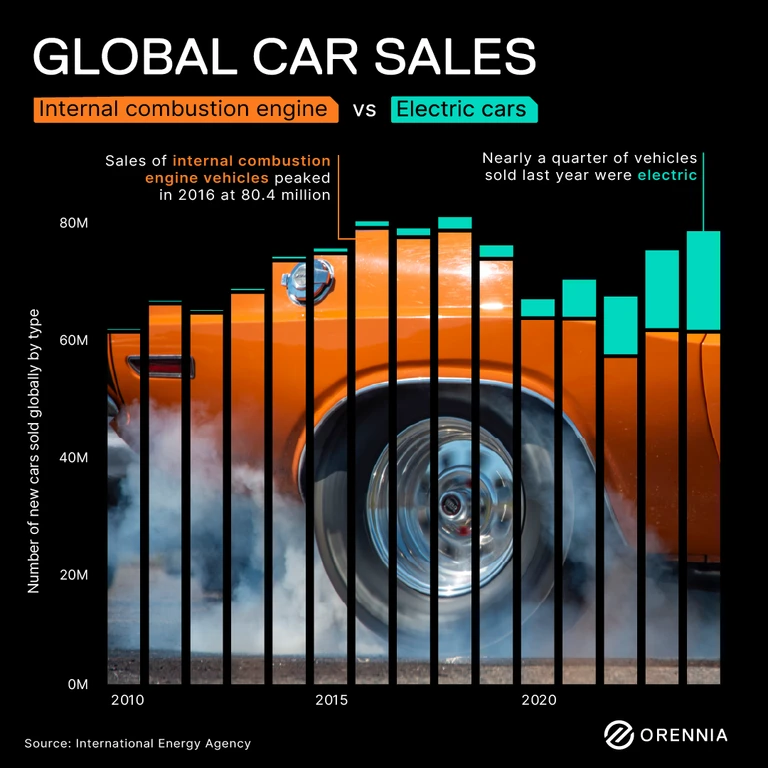
Global sales of internal combustion engine vehicles have been sliding for nearly a decade, and the skid marks aren’t stopping anytime soon.

The market value of critical minerals continues to sky rocket, leading companies and governments to look at developing some of the largest, most concentrated mineral deposits on Earth, found under the sea.
Learn how China has turned around its emissions and has set its sights on decarbonization.
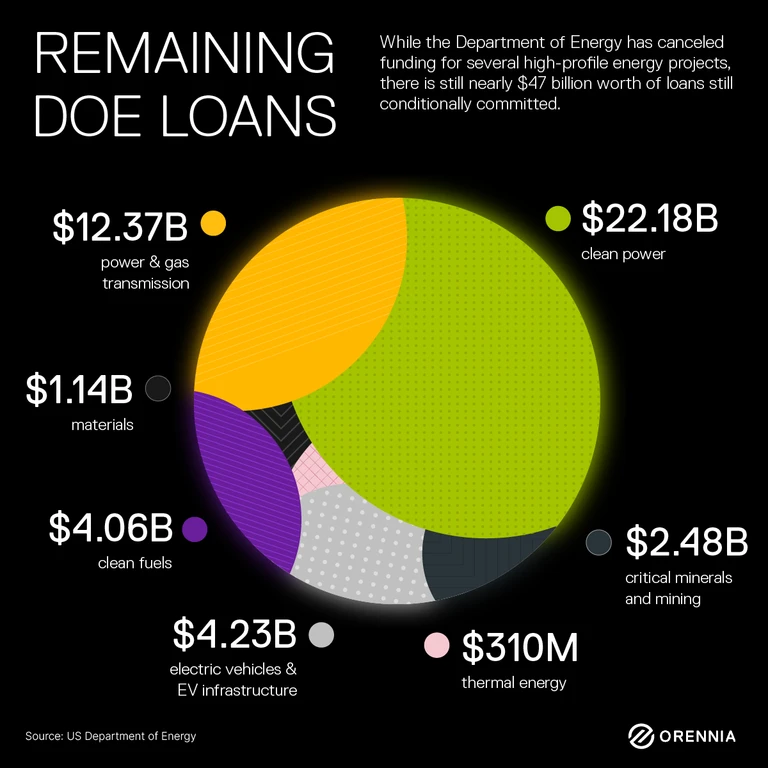
While the Department of Energy has canceled funding for several high-profile energy projects, there is still nearly $47 billion worth of loans still conditionally committed.
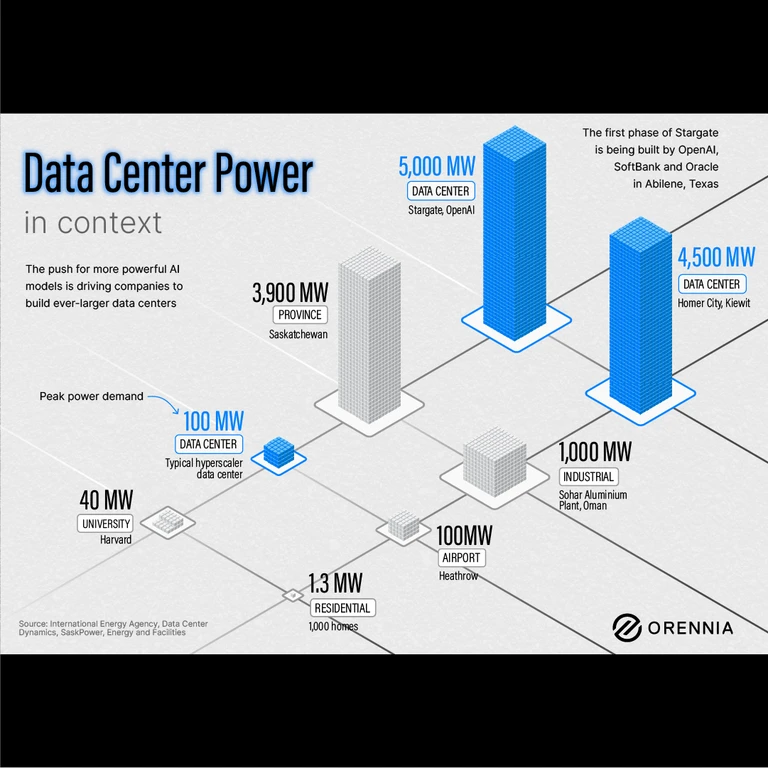
Data centers are rapidly becoming some of the largest electricity consumers in the world. A single hyperscale data center can draw between 20 and 100 megawatts, similar in scale to a major hospital campus or even a moderate industrial plant.

Find out how valid the concerns over battery storage project fires really are.

By the end of the decade, there could be 20 million new jobs across the various energy sectors but in North America, filling these new roles will be a challenge.
Orennia has collected thousands of announced power project price contracts, known as power purchase agreements (PPAs). So what is the lowest PPA in our platform?
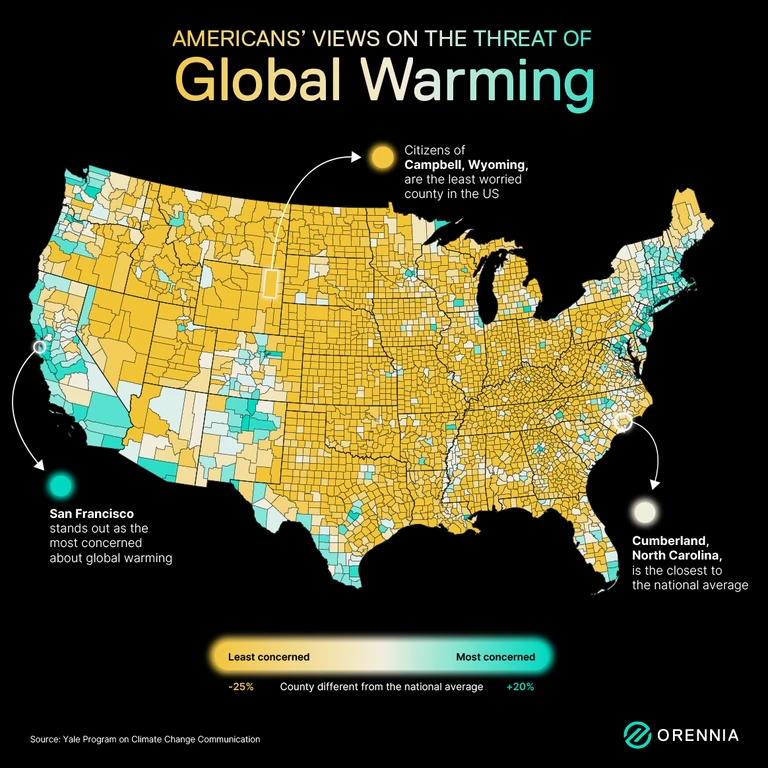
Explore the wide and diverging views on the impact of global warming and climate change.
China's export controls on critical minerals could severely impact America’s ability to build a modern 21st century economy and keep pace with national defense.
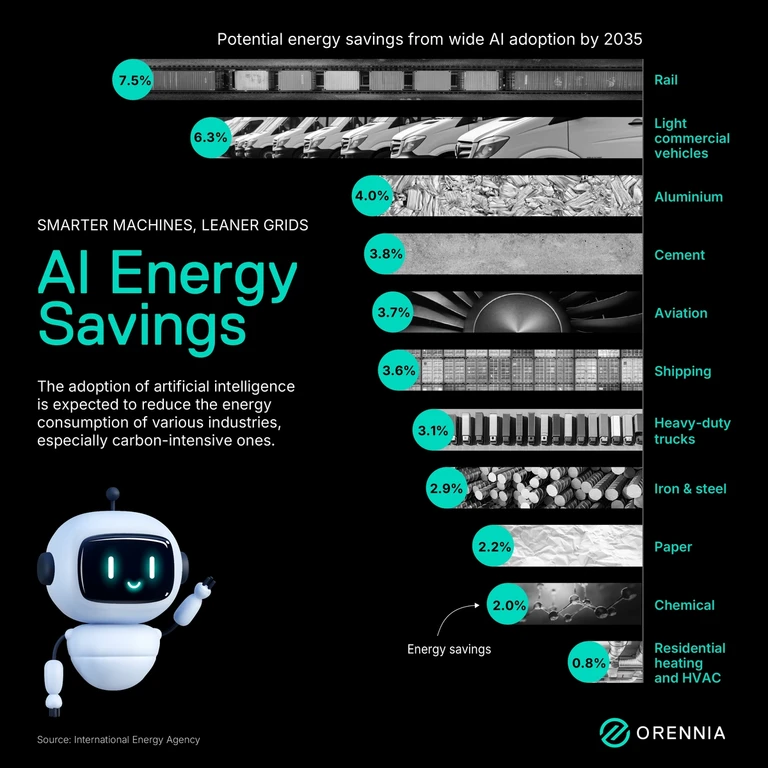
Widespread adoption of AI is expected to help a number of industries reduce their energy use.

Find out how humanoid robots will impact energy use with at home draw and model training at a grid level.
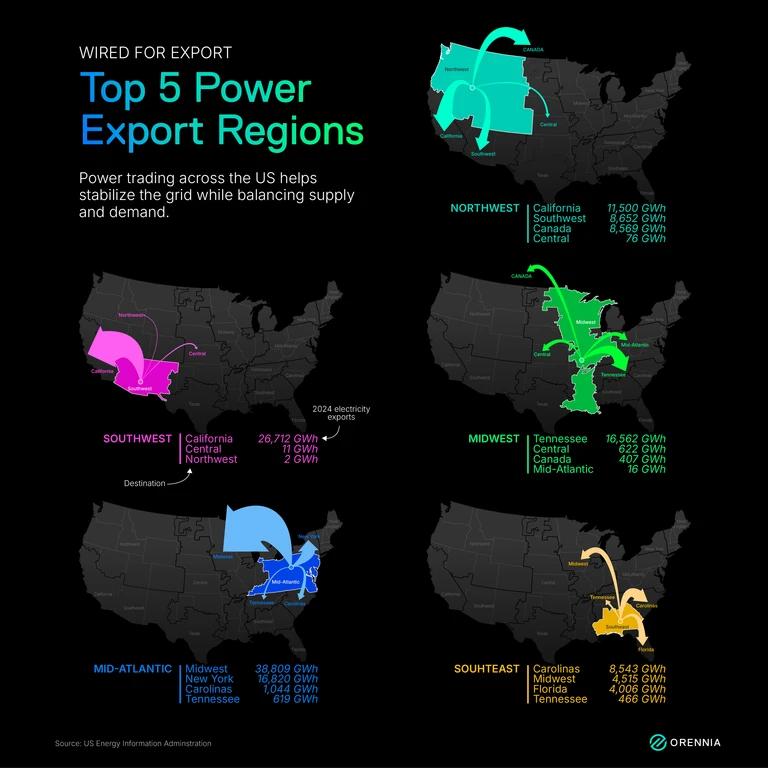
In America’s fragmented electricity landscape, not all regions produce what they use and a few stand out as key power exporters.
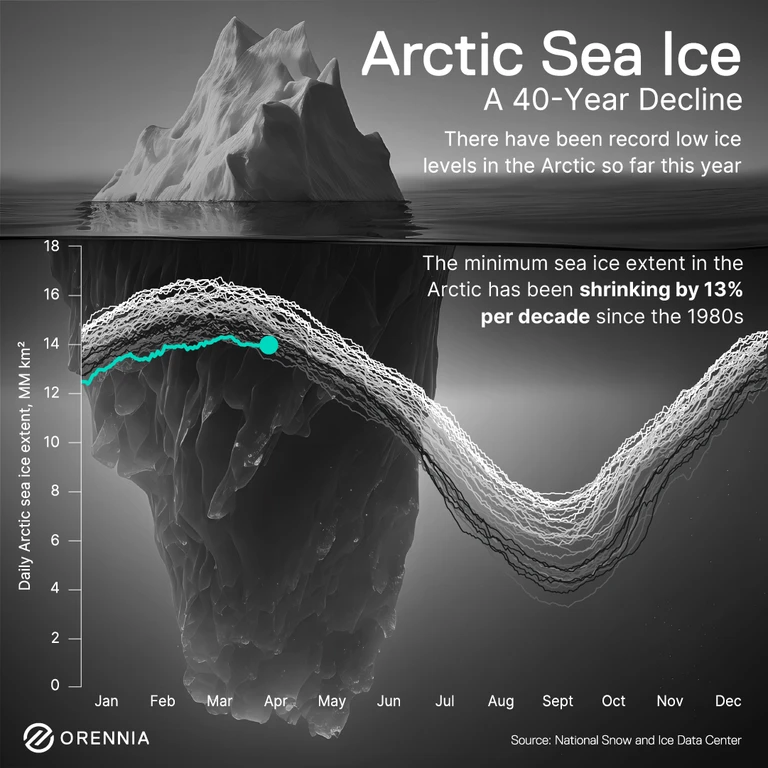
The Arctic is warming nearly four times faster than the rest of the planet — a shift that’s reshaping the global climate in real time.
Explore the increasing calls for eminent domain to be used more regularly to accelerate energy development.
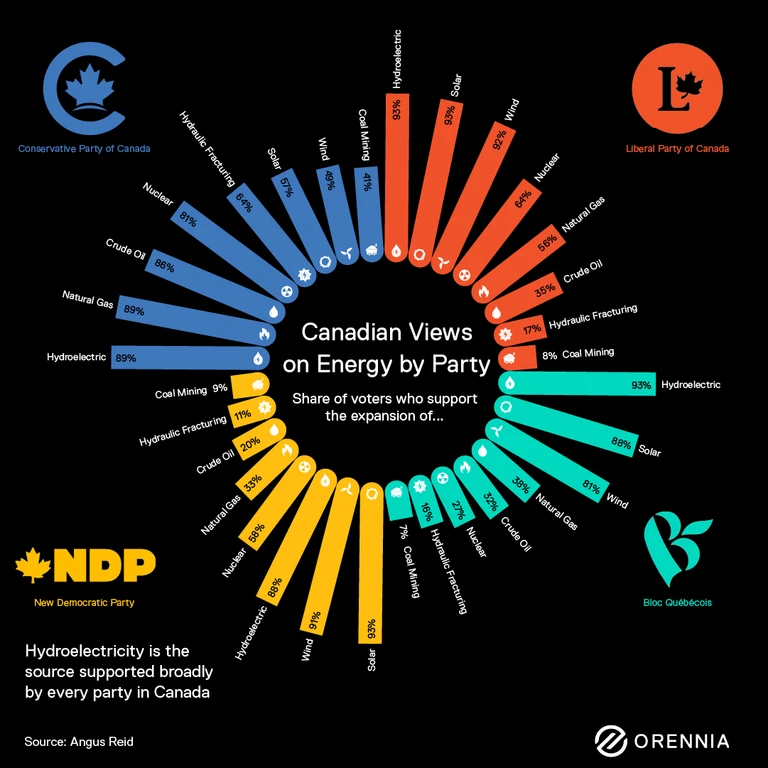
Canadian views on energy by party according to a February poll by Canadian pollster Angus Reid.
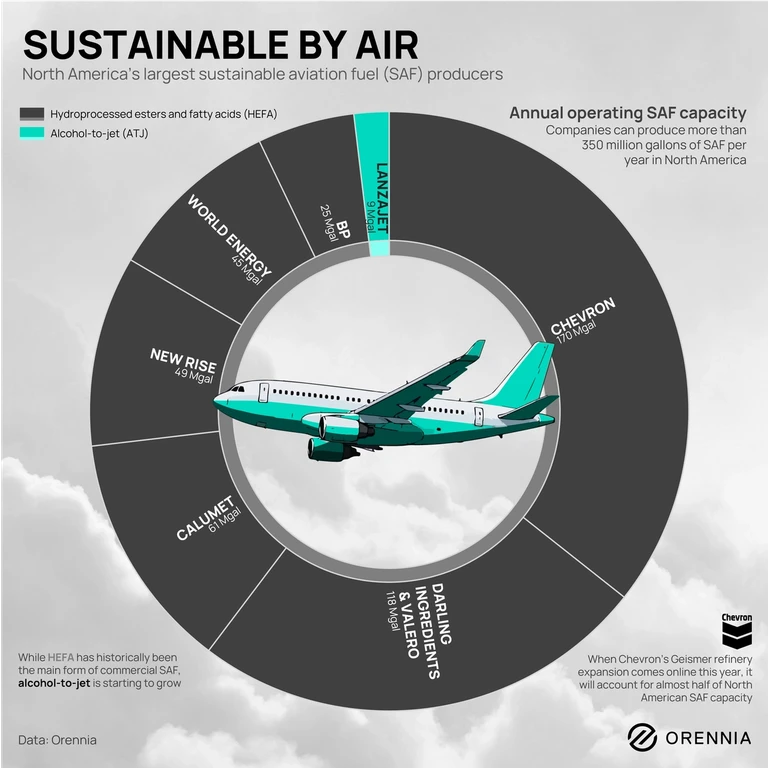
Sustainable aviation fuel (SAF) remains one of the only viable ways to reduce flight emissions. Take a look at the largest producers in North America.

In normal circumstances, there’s probably no better state than Texas to build new power projects quickly to meet the new data center demand, but Bill 388 would impact that ability.
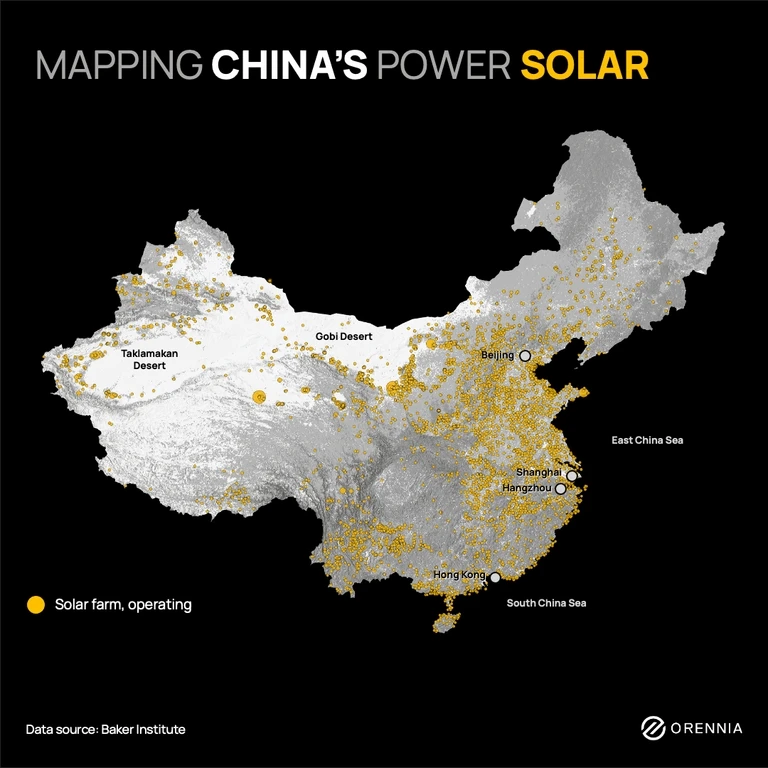
China is an energy paradox filled with fascinating contradictions. Explore its energy generation.

Will gas power be the AI savior many are hoping it will be or will shortages turn out to be too large to overcome?

Since 1901, the US and Canada have increased reliance on each other’s energy and infrastructure but how much leverage do Canada’s power exports truly give the country?
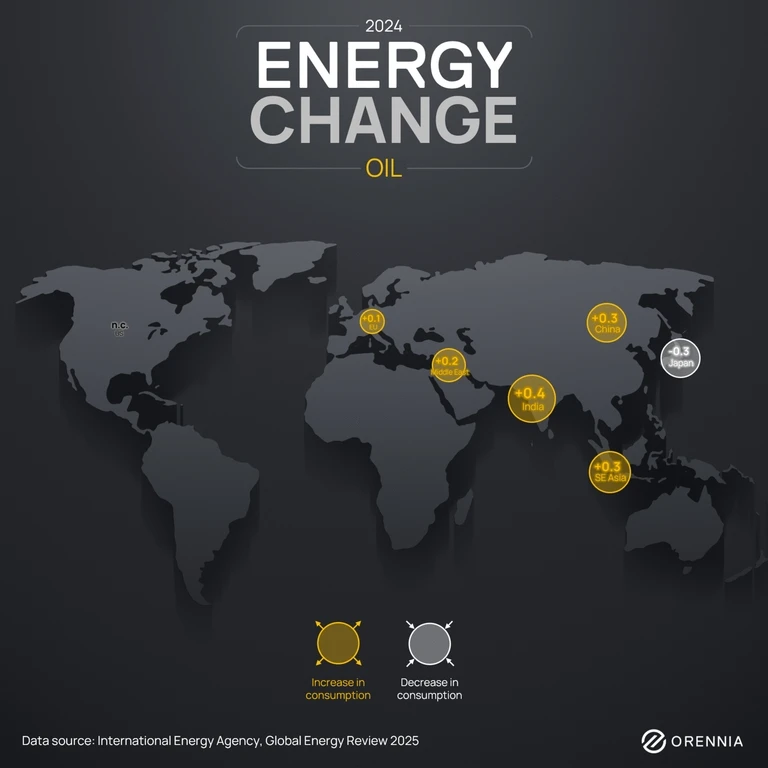
Get the highlights of the International Energy Agency's Global Energy Review for changes in energy use in 2024.
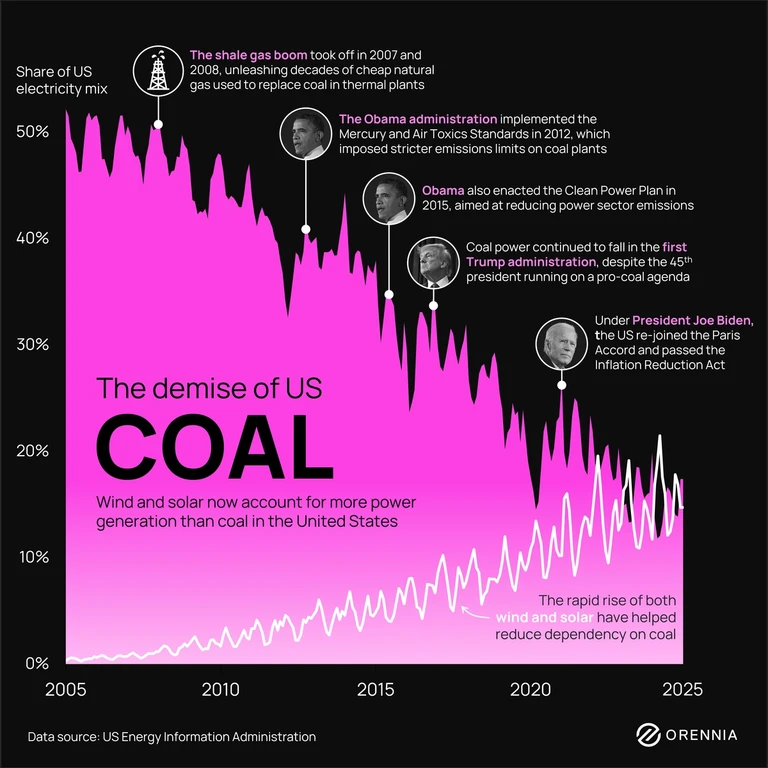
Americans are using coal a lot less than they were in the early 2000s. Wind and solar combined now generate more power in the US than coal, a significant change in just two decades.
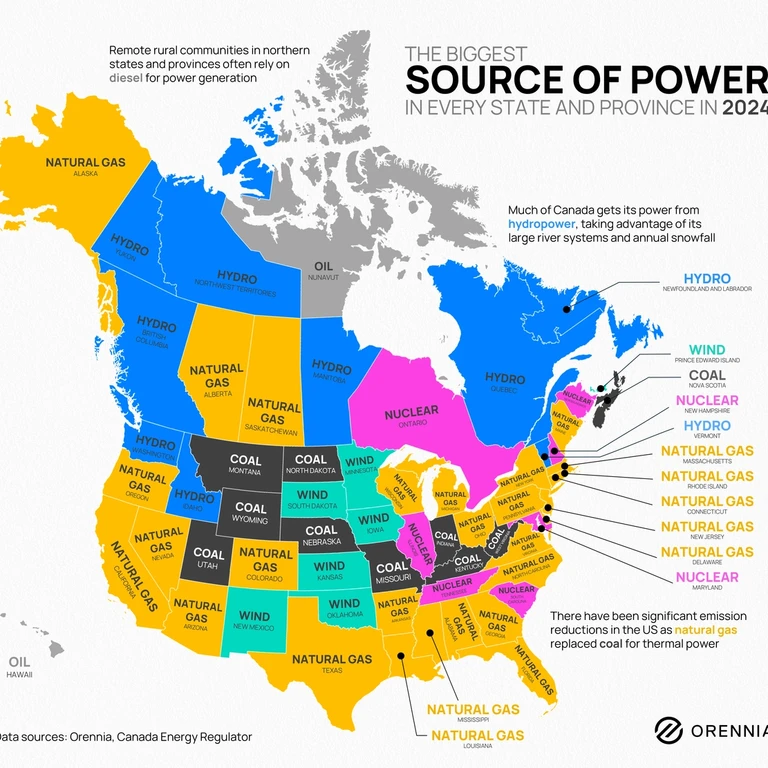
Power generation across the US and Canada is tied to long histories of natural resource development and technological innovation. See the biggest source of power in every state and province for 2024.

Through its unique ability to both store carbon and foster plant growth, biochar has unexpectedly emerged as one of the top solutions to remove carbon dioxide from the atmosphere.

While the progress of women in energy continues to move forward, there is still a long way to go in the sector for better representation.
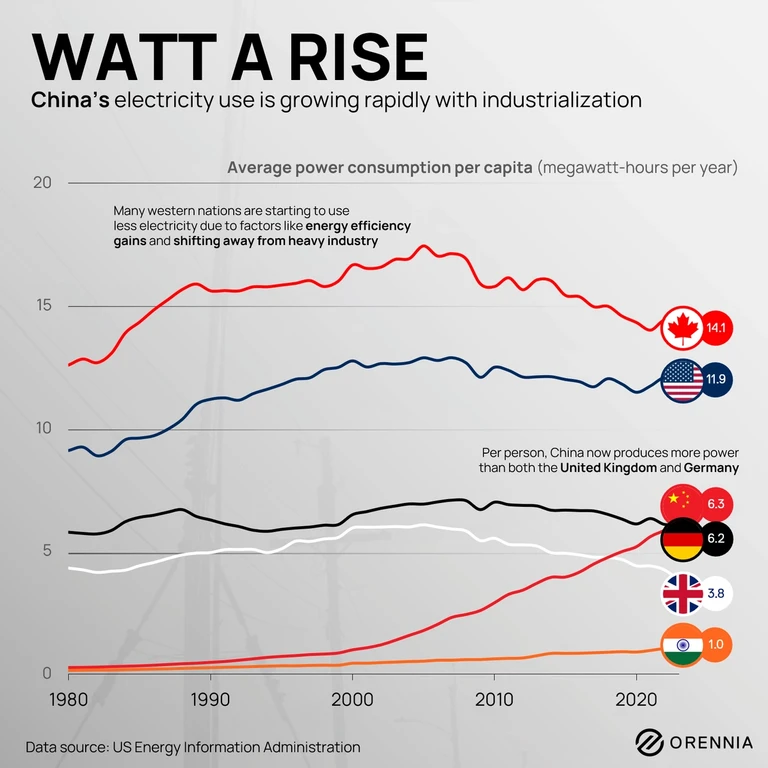
Industrialization and an exploding middle class have caused rapid growth in China’s power consumption. See how various countries compare.
Building clean energy is not enough. The energy emergency the US is facing is really about a lack of transmission and capacity.

Influenced by everything from crude oil cycles to Midwestern crop harvests, the biodiesel industry carefully tracks the bean oil-heating oil (BOHO) spread as a key metric, and there are big changes coming.
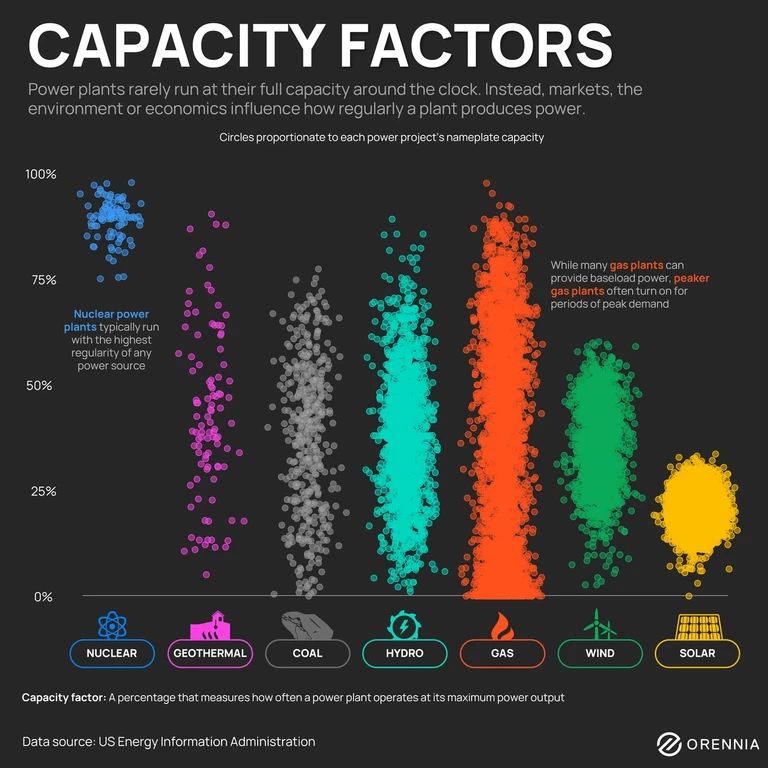
Defined as how often a power plant runs at full power, capacity factors (CF) are useful in helping develop and finance projects and to study the impacts to the grid on new projects.
What are the challenges facing solar project development today? Interconnection agreements, permits and land agreements are all required to develop solar projects.
Unlike many commodity industries, where large firms grow universally, the large power producers today are often rooted in decades of history.

What happened with the Decatur CCUS project. Was it a strike against carbon capture projects or a showcase for some lessons on how to do it better?
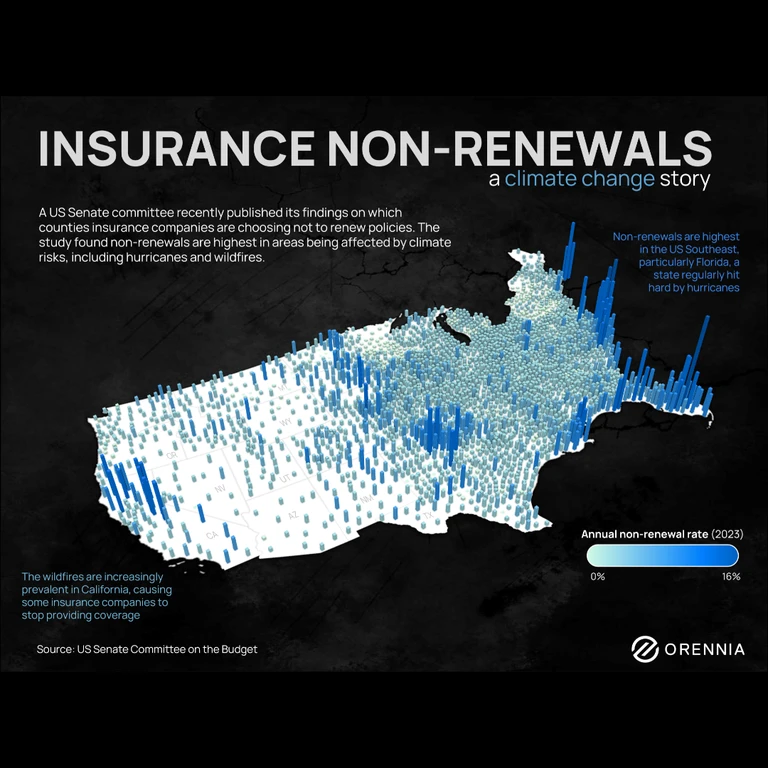
In December, the US Senate Committee on the Budget reported that climate change is driving higher insurance non-renewal rates in disaster-prone areas. As extreme weather events increase, premiums rise, and insurers often cancel policies when they can't keep up with the risk.

Take a look at data center investment and the potential impacts of AI, data, power supply and workforce resources.
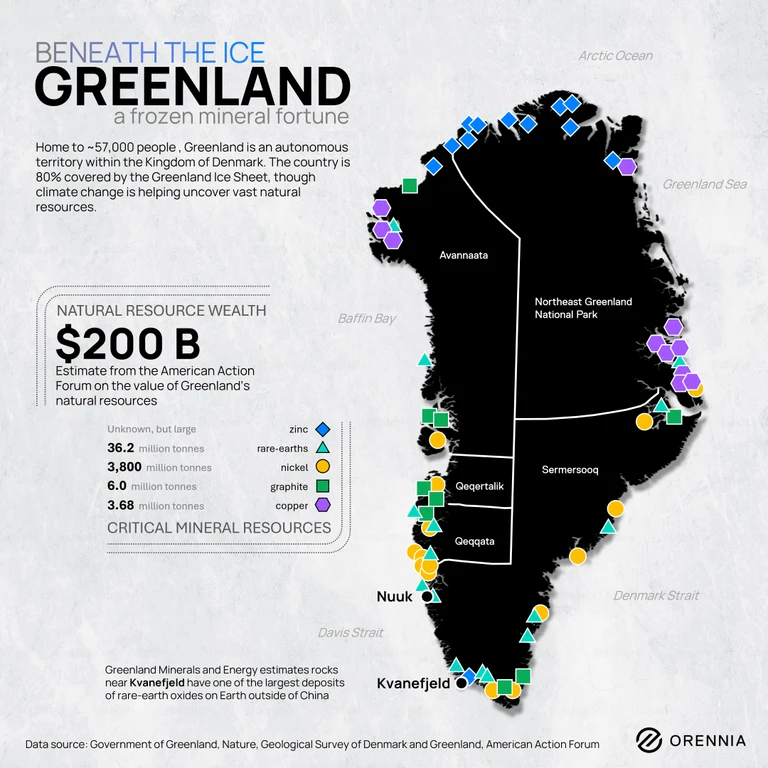
President Donald Trump has indicated that acquiring Greenland would be of interest for his administration. Why? Greenland contains both a wealth of minerals and sits in a globally strategic location.

Get a full recap of the energy transition market trends over the past 12 months and gain valuable insights for the coming year.
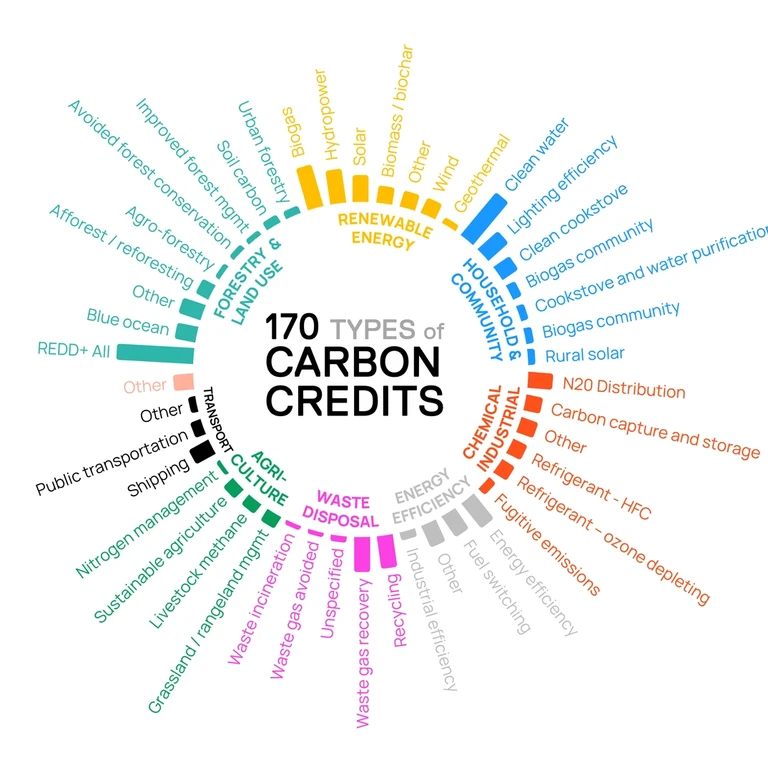
After breaking out in popularity in 2021, voluntary carbon markets have been plagued by scandal and controversy.
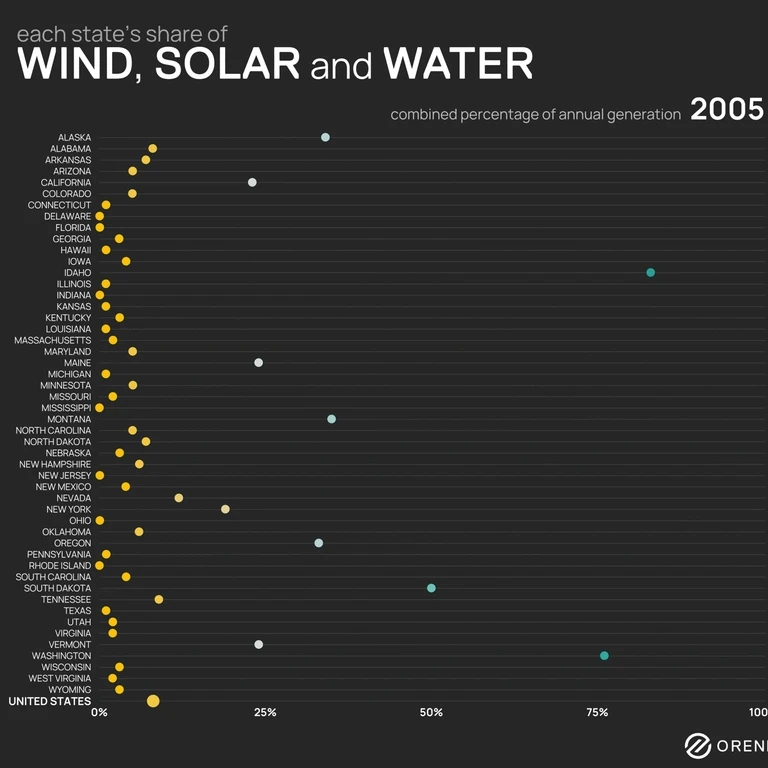
Over the past 20 years, the US has seen remarkable growth in its renewable energy sector, with wind, solar, and hydro emerging as cornerstones of the nation’s transition to cleaner energy.
Form Energy, a Massachusetts-based battery startup, has emerged as a funding and media darling.
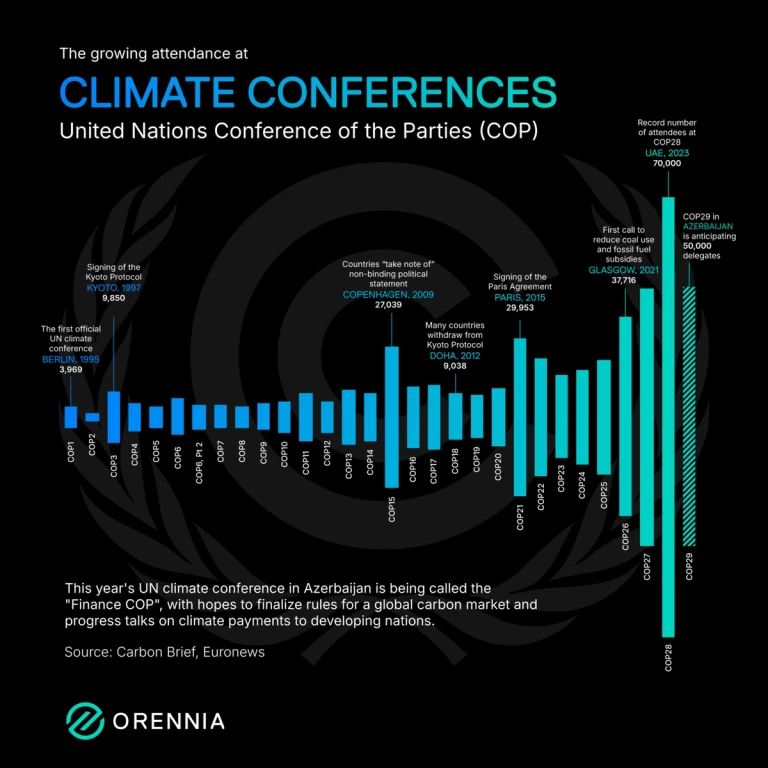
Attendance at United Nation’s climate change Conference of Parties (COPs) has been increasing over the years, reflecting growing global concern and engagement with climate issues.
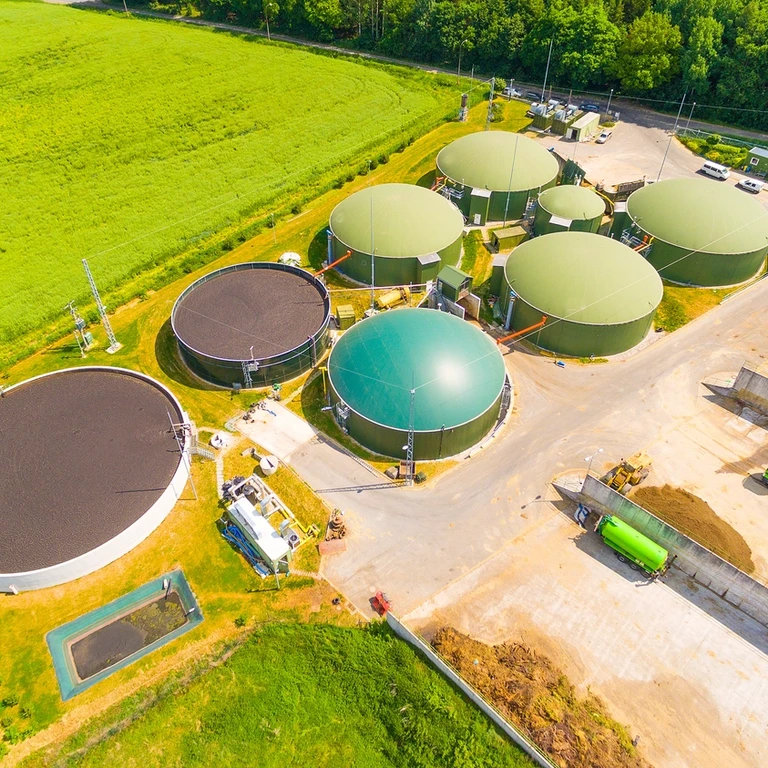
Biogas innovation meets data center demands. Explore RNG's role in delivering reliable, low-carbon backup power for tech giants.
Electricity generation across the US and Canada varies by region from differences in geography, available natural resources, and energy policies.
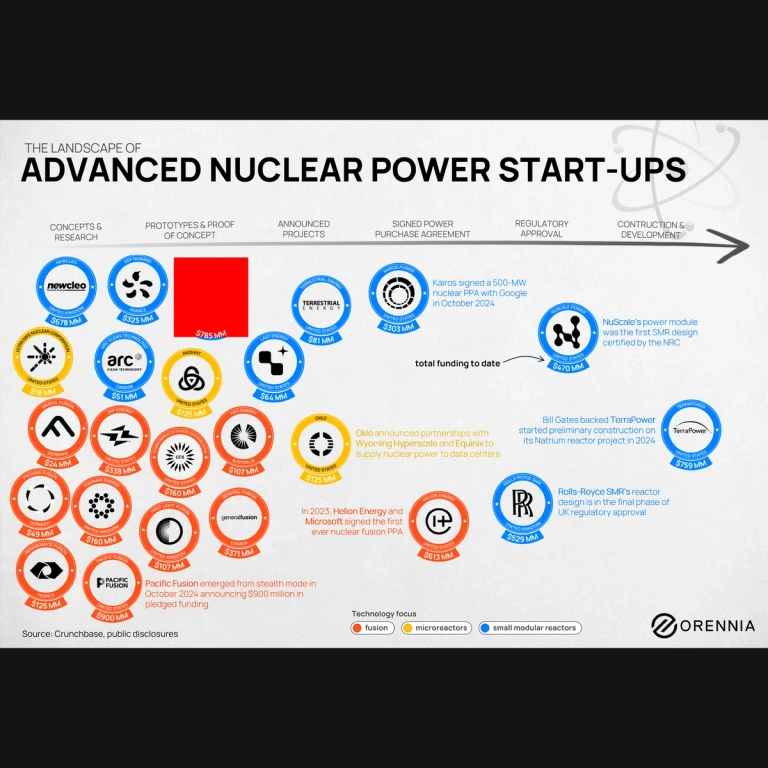
A wave of new nuclear companies has emerged, driven by the need for clean baseload power. Particularly Big Tech companies and data center builders are driving enthusiasm for the technology.
Can harvesting wood for energy help reduce emissions while preserving forests? Unpack the promise and controversy of BECCS.

Explore the energy winners and losers of the data center boom. Learn who's thriving and who's struggling in this industry shift.
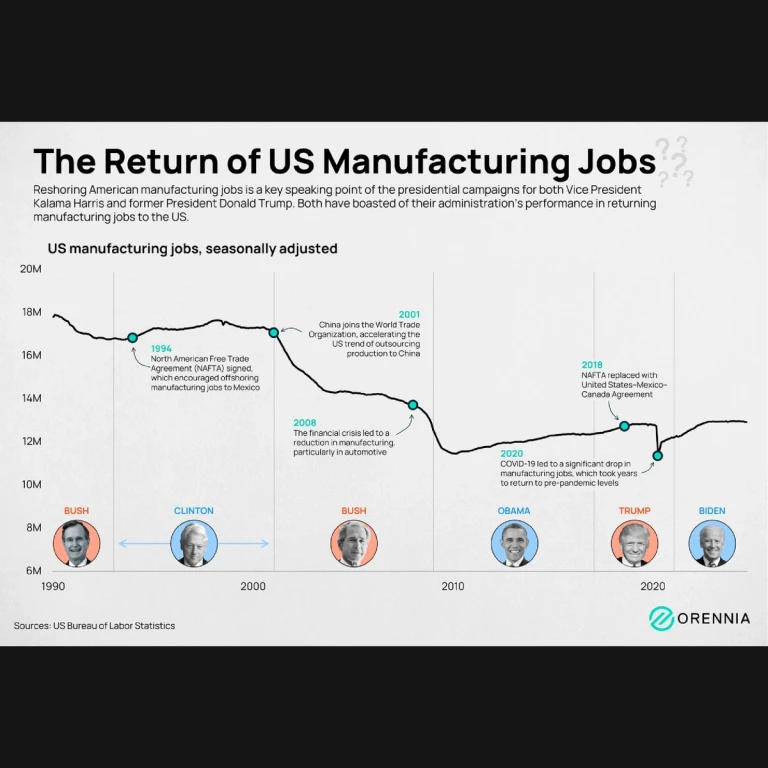
Can the US manufacturing sector reclaim its strength? Explore key trends shaping jobs, trade, and resilience. Learn more now.
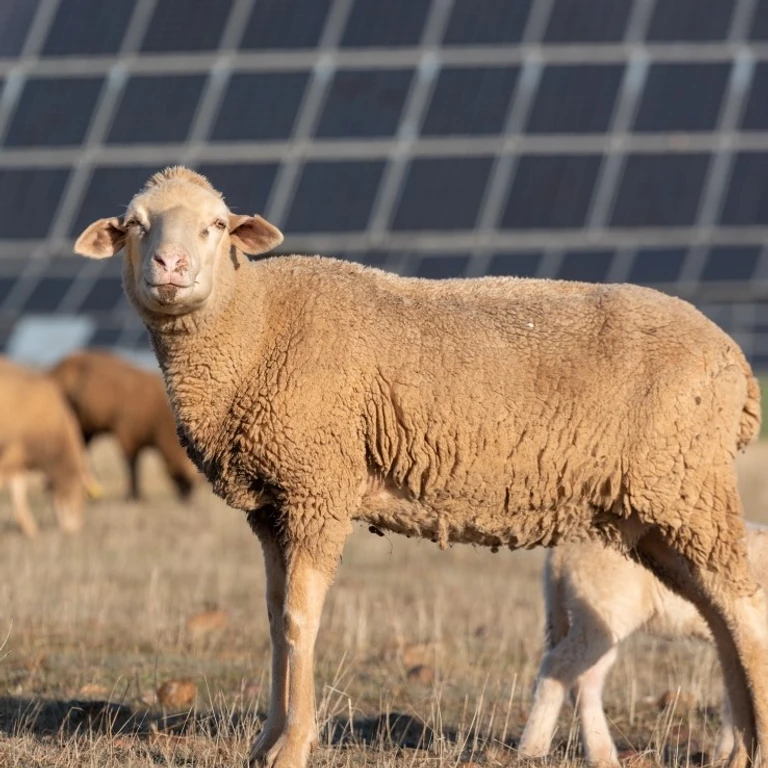
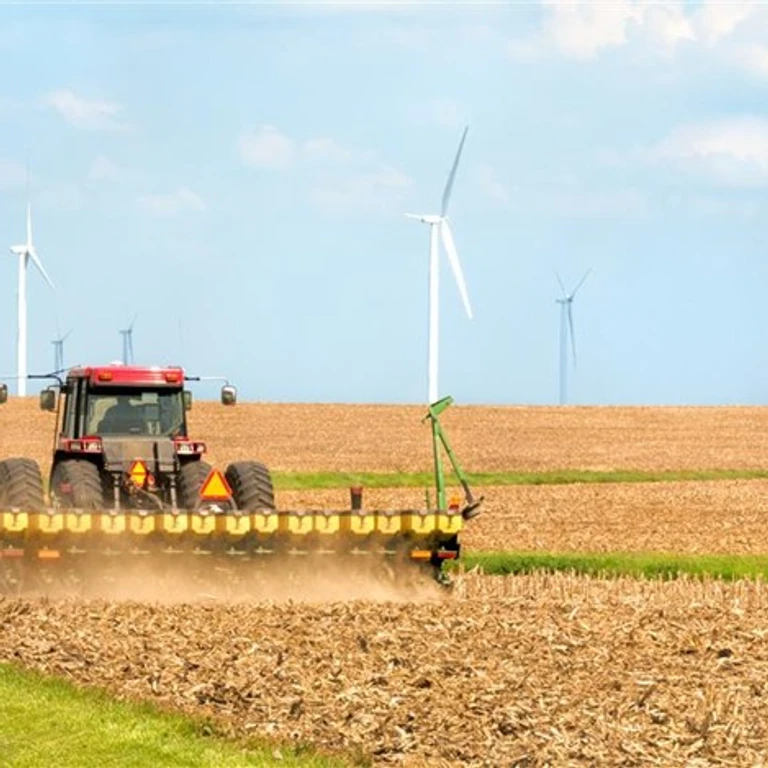
Can farmland and solar panels coexist? Explore agrivoltaics, the practice of combining farming and solar, and its potential impact.
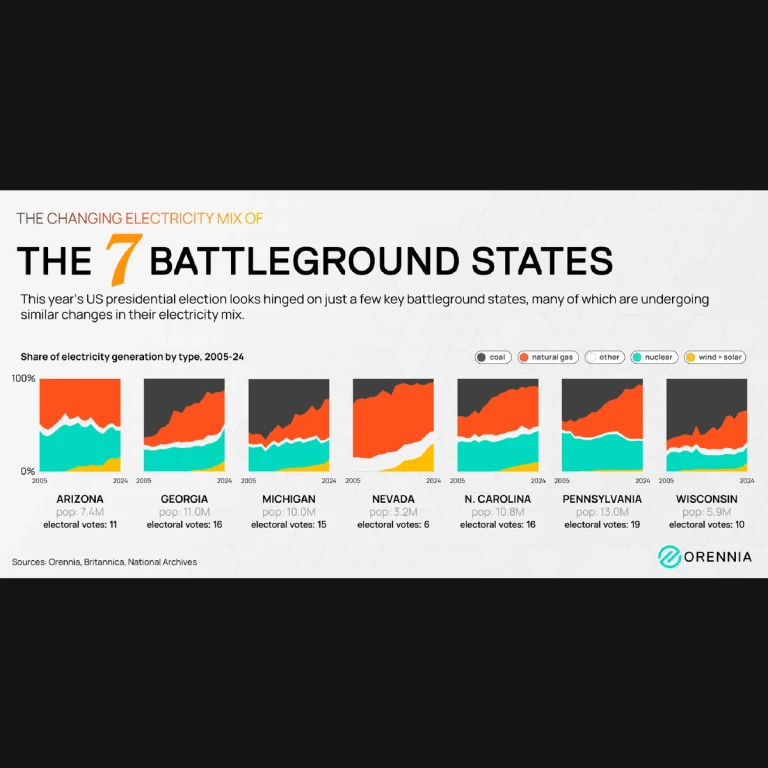
How do swing states balance natural gas and renewables in their energy mix? Explore trends shaping the 2024 election and beyond.
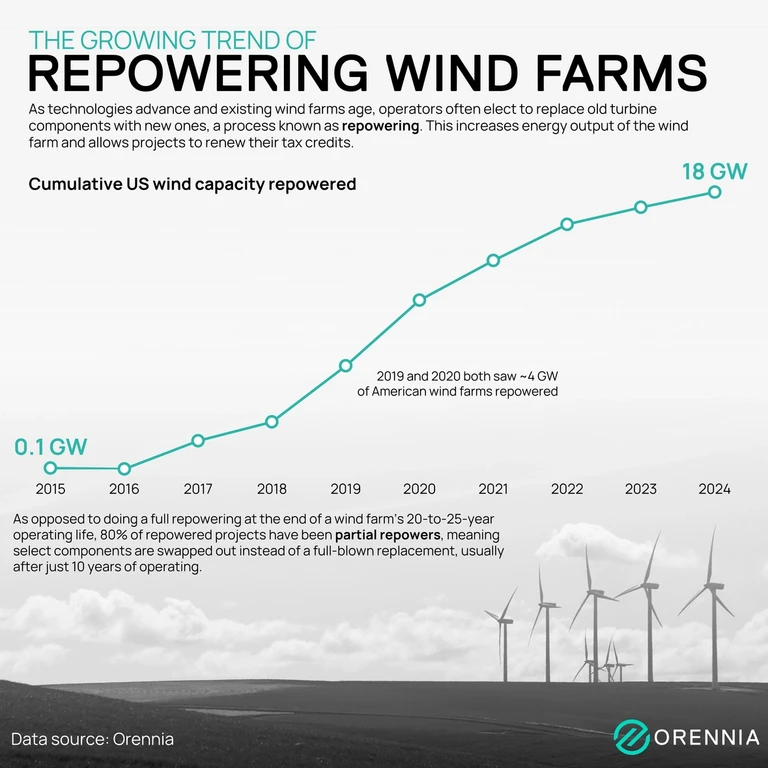
Many of the early wind power projects installed in North America are ripe for an upgrade. Wind repowering is a process that involves replacing old wind turbines or their components to capture more energy, improve performance and often requalifying for tax credits.

Explore the current state of North American carbon markets and their role in driving the energy transition. Opportunities ahead.
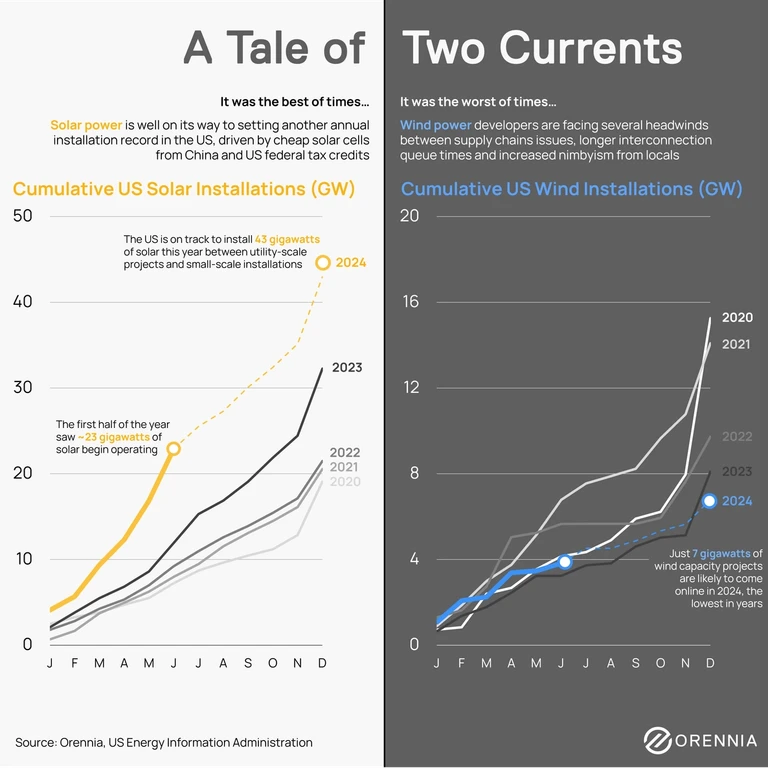
Orennia forecasts 37 GW of U.S. solar growth in 2024 while wind slows to 7 GW, highlighting a shift in renewable momentum.
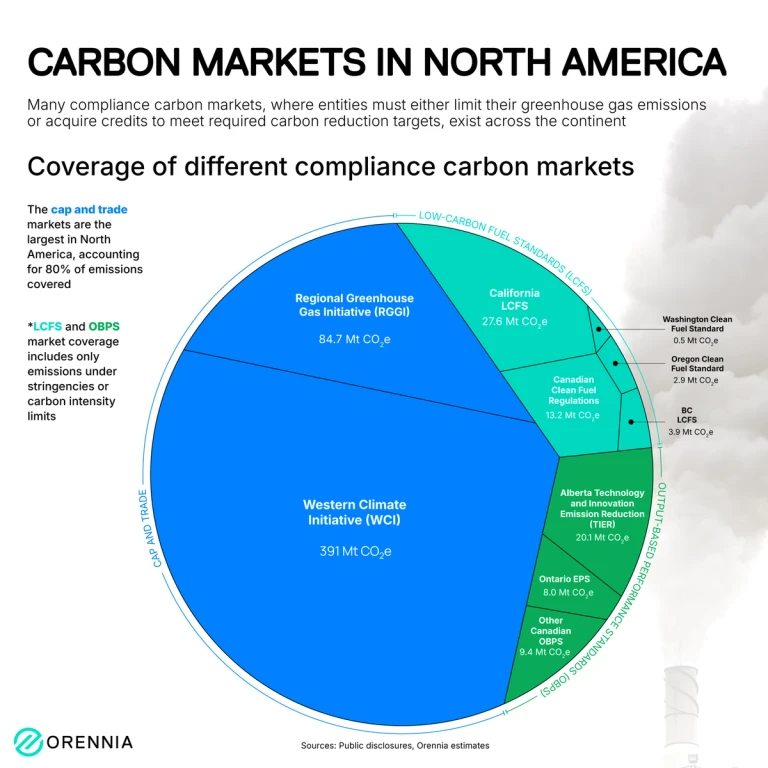
Carbon markets are increasingly popular as a market-based approach to reducing greenhouse gas emissions. They offer financial incentives to companies to decarbonize by placing a cost on carbon emissions while offering credits for overachieving reductions.
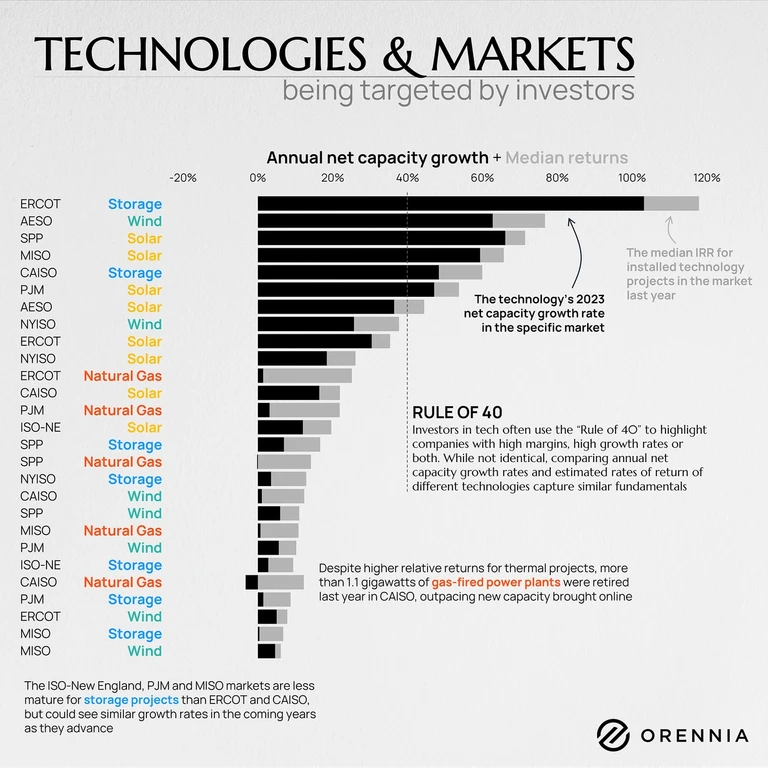
Clean power projects, particularly solar and storage, are growing quickly across North America. What are unique ways to capture investor sentiment?
The central reason policy makers care about industrial heat is that the sector is responsible for more than 20% of global carbon dioxide emissions. In the US alone, an estimated 759 million tonnes of carbon dioxide come from industrial heating annually.
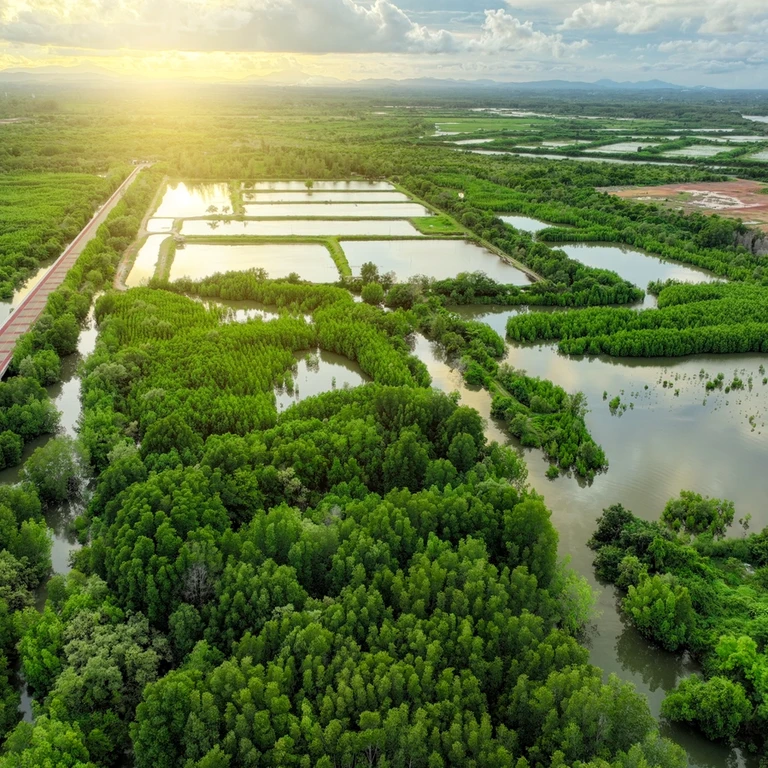
Dive into the Energy-Water Nexus: Explore how water scarcity impacts energy and the role of new tech in this evolving challenge.
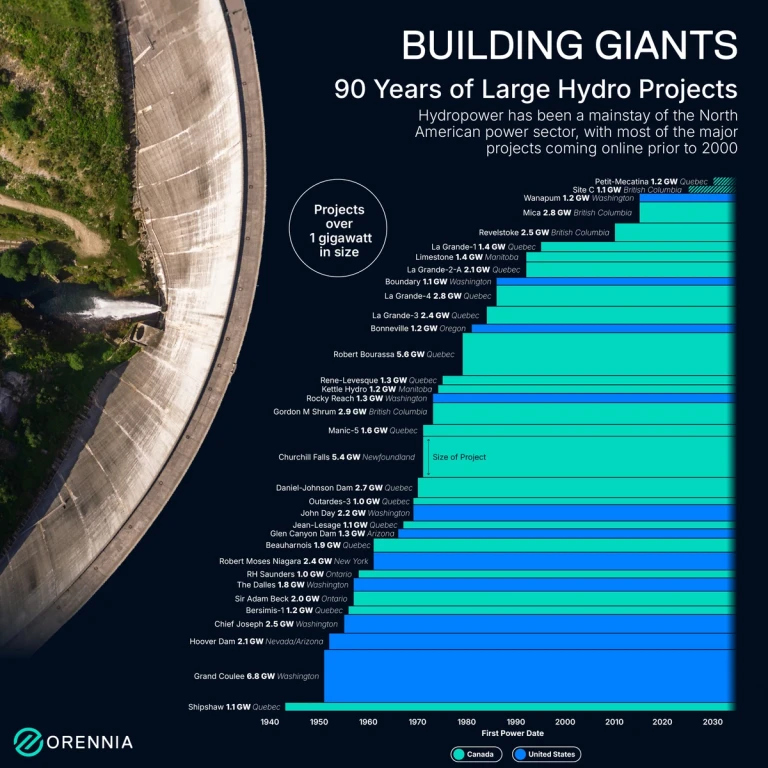
North America has a rich history of large-scale hydroelectric projects, which have played a significant role in shaping the continent’s energy landscape. These projects harness the immense power of rivers to generate electricity, providing a renewable and reliable energy source.
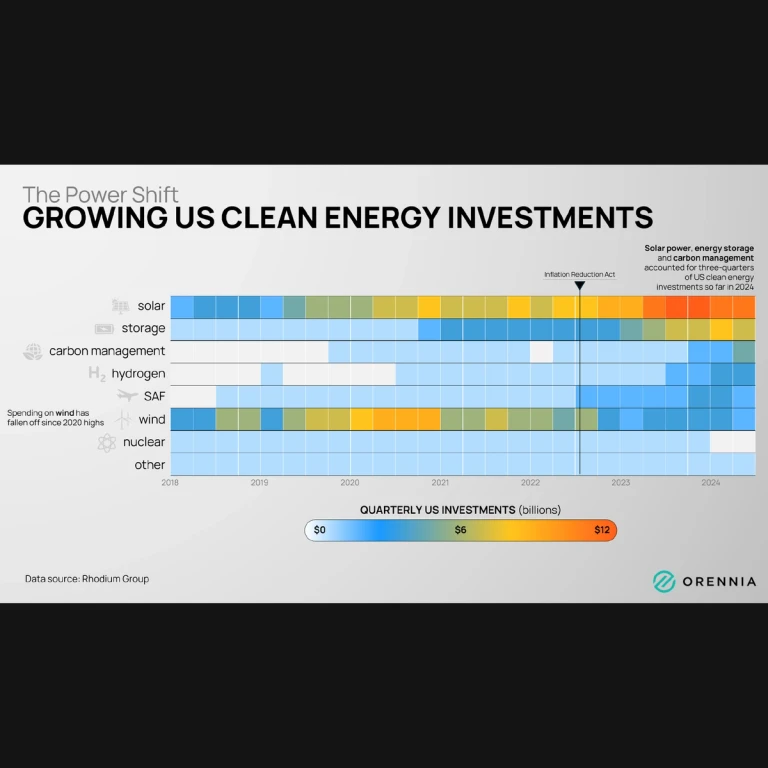
Clean energy investment in the US has been growing substantially in recent years, reflecting a broad-based shift towards sustainable energy solutions.

Unlocking the potential of ancient geology to permanently store CO2 and help tackle climate change through mineralization.
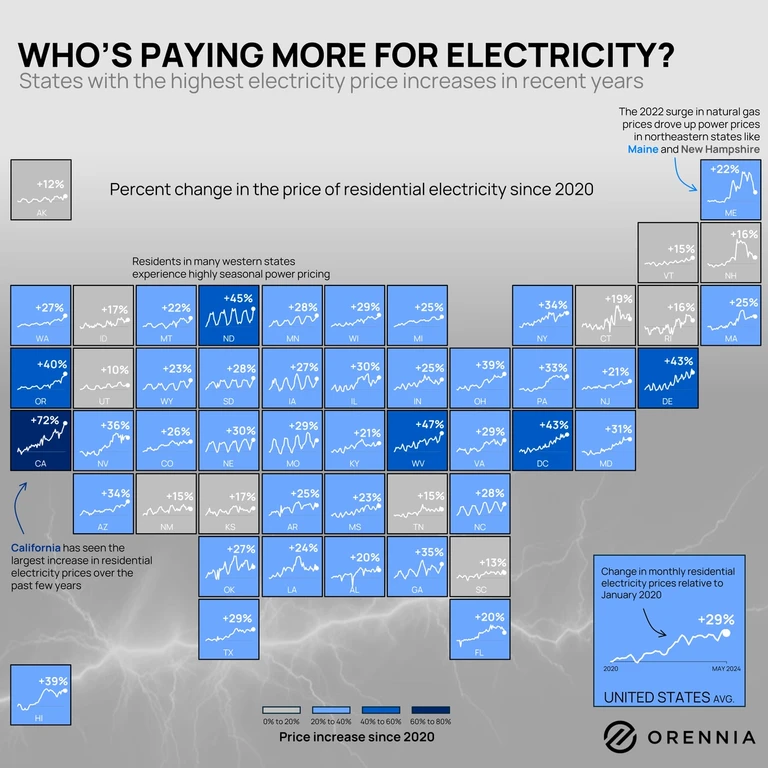
U.S. residential power prices surged ~30% since 2020, driven by rising fuel costs, grid upgrades, and regional factors.

Electric vehicles will soon do more than charge—they'll power the grid, driving the future of energy with vehicle-to-grid technology.
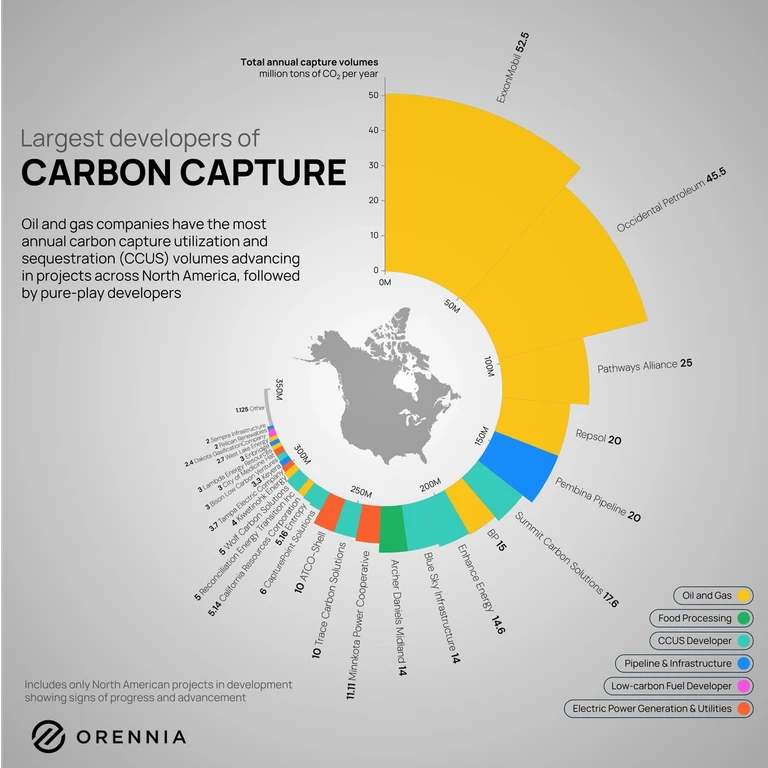
Carbon capture, utilization, and storage (CCUS) reduces CO2 emissions from industry by capturing, using, or storing it safely.
Explore the rise of data centers and their impact on the energy sector. Learn how AI is shaping future energy demand.

Unlocking ammonia's potential as a low-carbon fuel, exploring its role in the future of sustainable energy solutions.
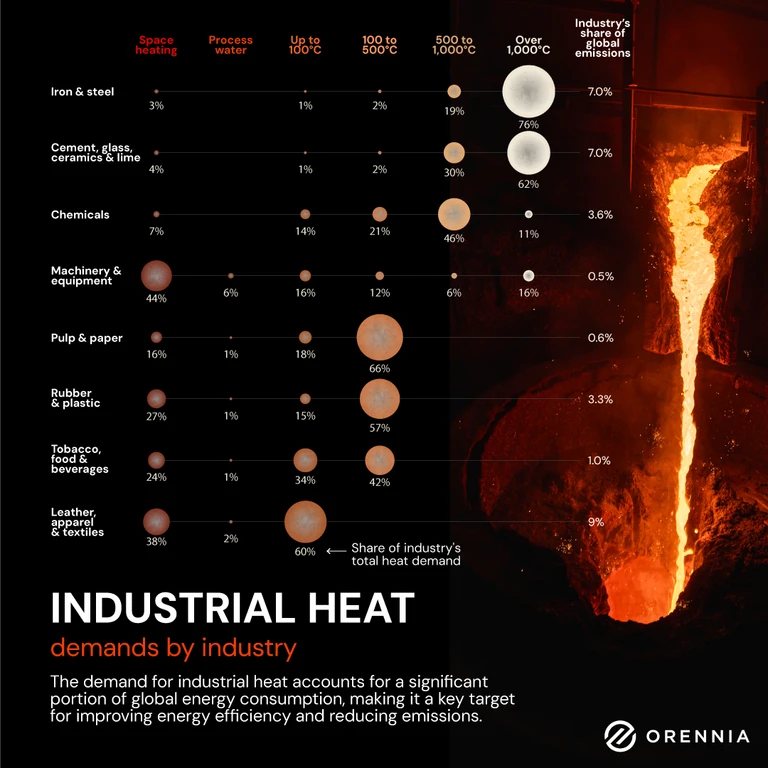
Industrial heat refers to the thermal energy needed for various industrial processes. It’s critical for manufacturing, driving everything from chemical reactions to material transformation. Industries like cement, iron and steel all require large amounts of hot industrial heat. Doing so creates large amounts of greenhouse gas emissions.

How IoT sensors and dynamic line ratings could transform grid transmission, reducing congestion and improving efficiency.
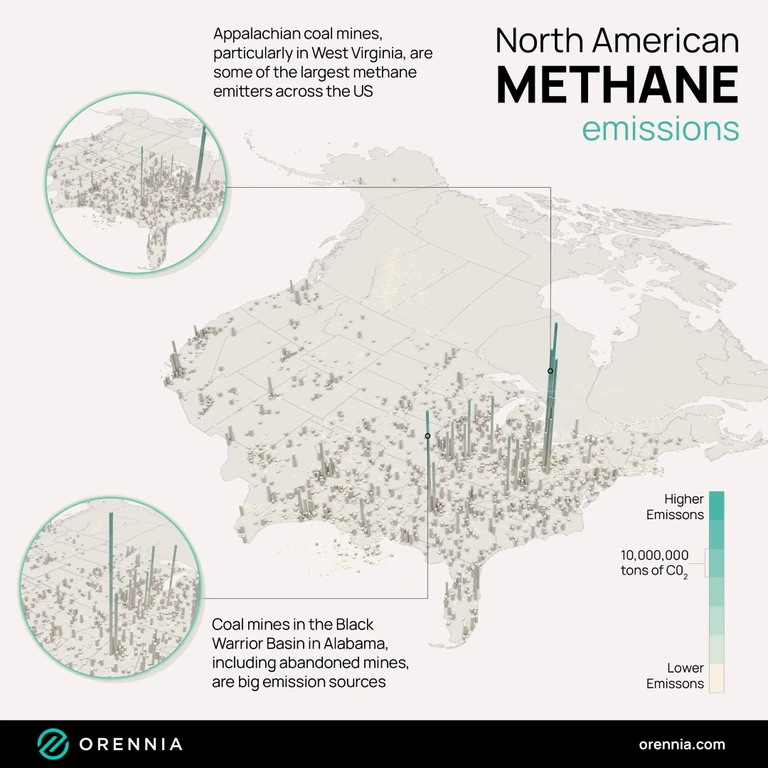
Methane poses a critical environmental challenge due to its potent impact on climate change. In both the United States and Canada, key sectors are key contributors for methane emissions, each with its unique regional hotspots.
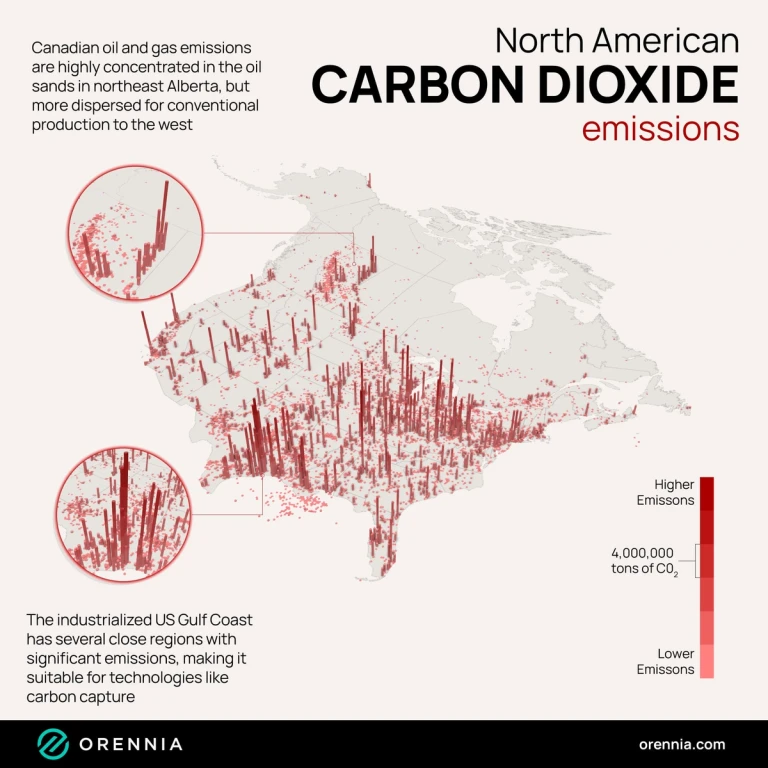
Carbon dioxide emissions dispersed across North America, though concentrated in regions with high populations and industrial activities. Areas with more aggregated emissions are focus areas for carbon capture technologies, low-carbon fuel development and clean manufacturing.

The importance of the big gray box in your cold, dark utility room. Dive into the critical role of electrical panels in the energy transition.
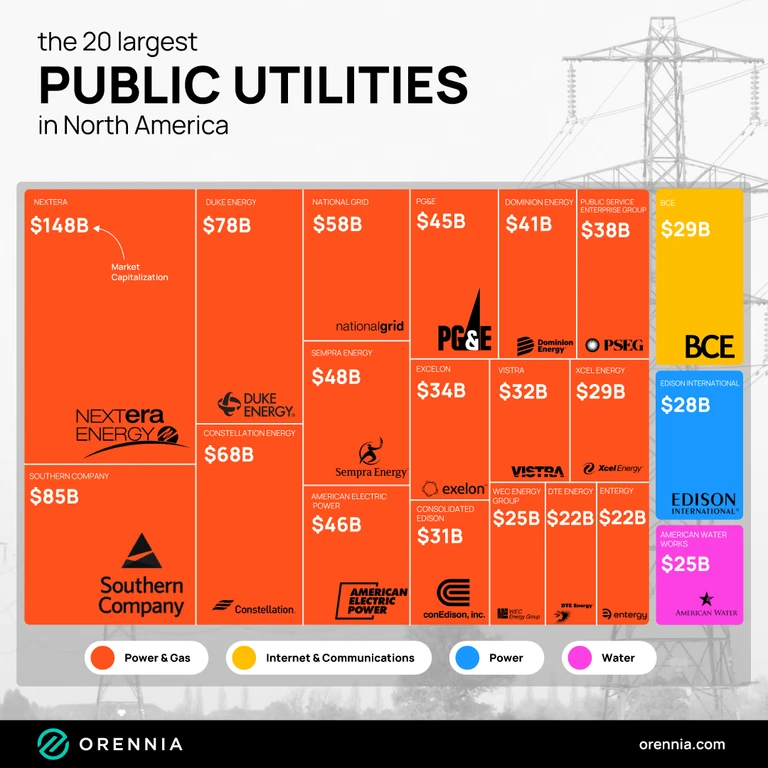
North American utilities provide vital electricity, gas, water, and sewage services, ensuring economic stability and quality of life.

Airlines face limited options to cut emissions. Carbon offsets raise skepticism, potentially adding reputational risk to the industry.
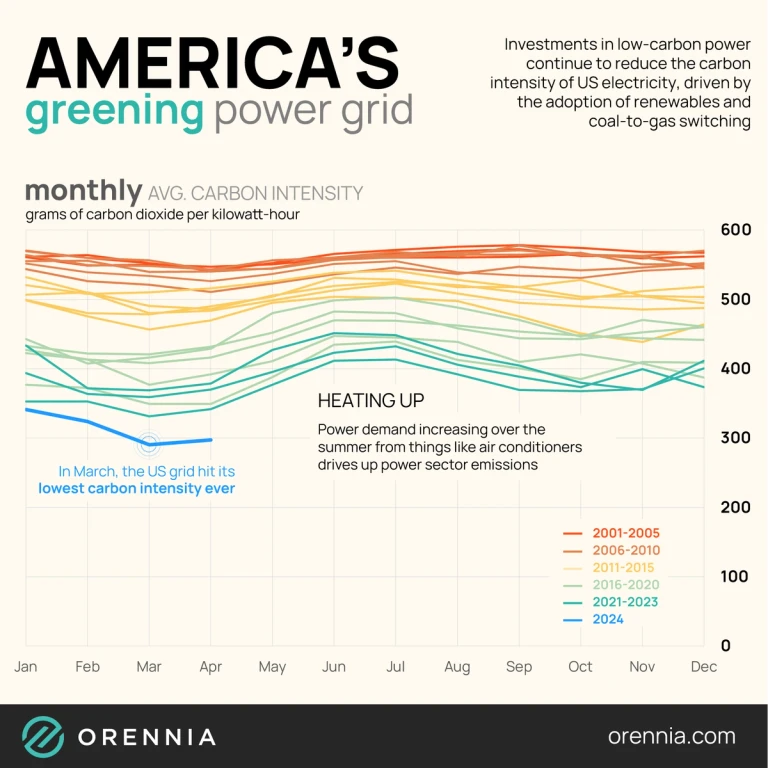
Cutting carbon intensity in the US grid has been a key focus of 21st-century policy and tech, driving environmental progress.
As renewables grow, energy grid congestion increases. Learn about the underlying causes and how this impacts the energy systems.
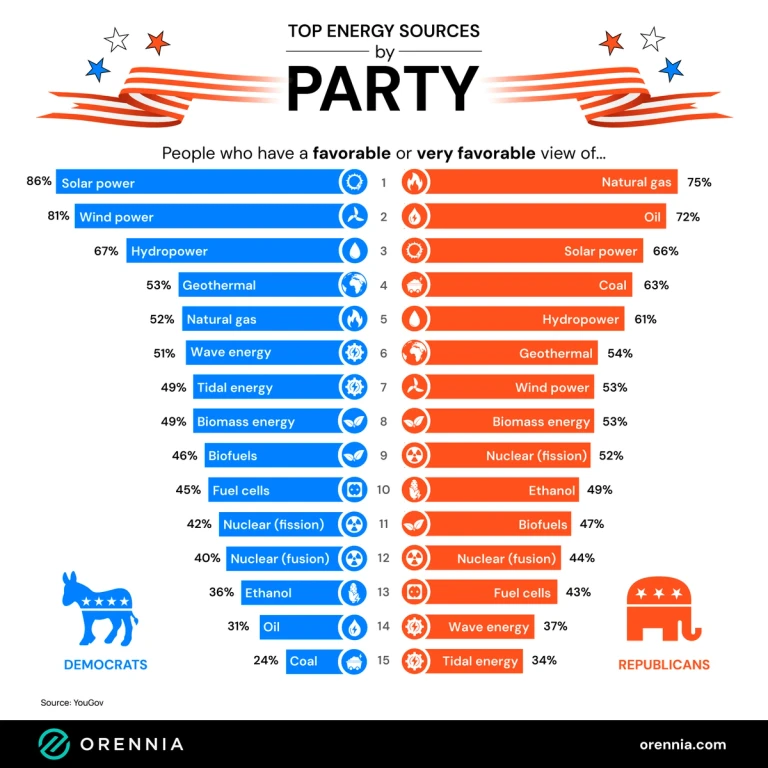
Analyze the political differences in energy preferences from a YouGov survey and understand the varying levels of support for 17 energy sources in US

VPPs may be cheaper than dispatchable capacity and help avoid unnecessary costs. See how they offer a solution to grid challenges.
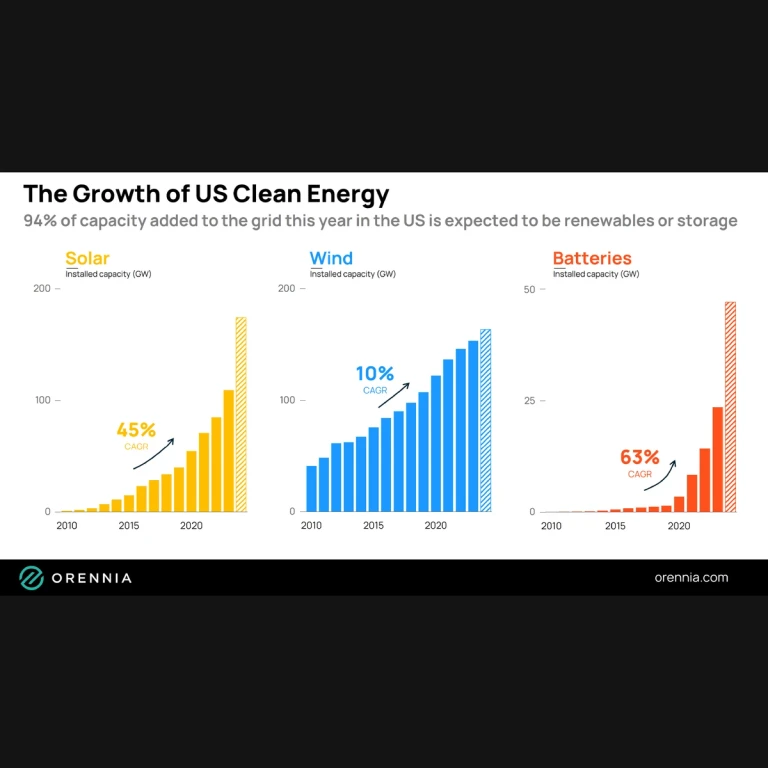
Over the past decade, the US has witnessed a significant shift in its energy landscape, characterized by rapid growth in wind, solar, and battery storage technologies. This transformation is driven by a combination of technological advancements, favorable policies, and a growing recognition of the need for sustainable energy solutions.

Low-cost hydrogen could spark industry change but may delay a true renewable economy, keeping dependence on non-renewable resources.
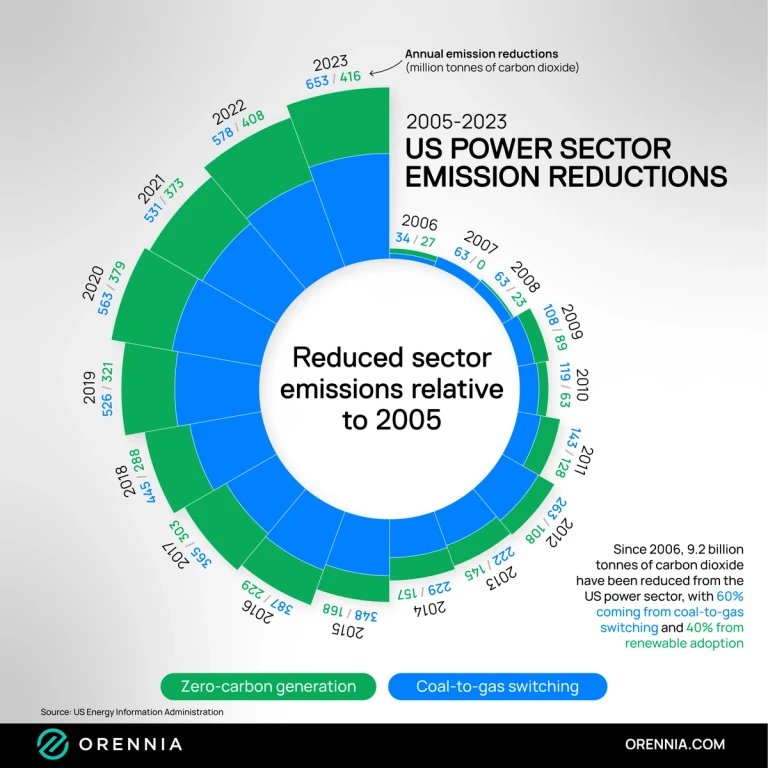
Transitioning from coal to natural gas and adopting wind and solar has been key to shaping a more sustainable energy landscape.
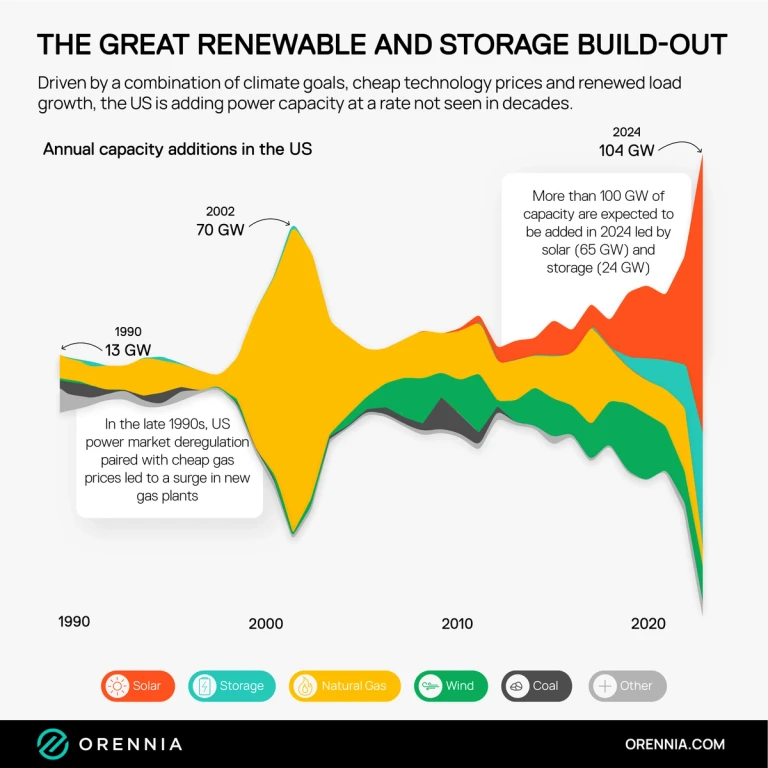
From natural gas dominance to rapid renewable and battery growth, the US energy sector is constantly evolving in the 2020s.

Small modular reactors may be the start of a new American nuclear era. Learn about the promise of SMRs in meeting future energy needs.
Prepare for hail, tornado, and fire season by understanding how to assess and mitigate extreme weather risks in your energy projects.
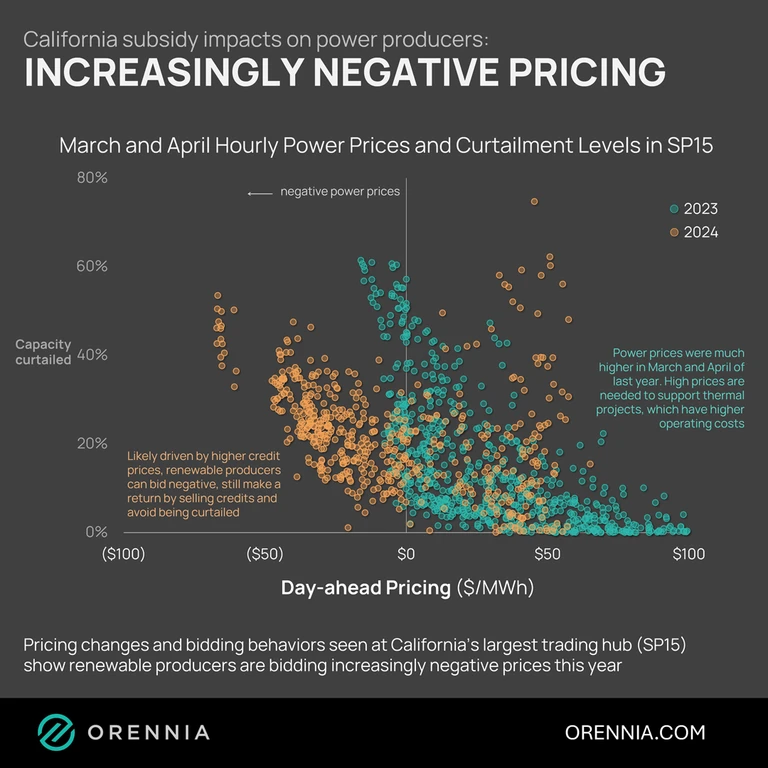
Negative power pricing in CAISO shows producers paying consumers to take electricity—driven by key market factors and dynamics.
Renewable growth is limited without economic long-duration storage. Most current projects focus on daily load shifting, not multi-day storage.

A new generation of geothermal technology is emerging, which may meet our growing needs for clean power.

Dive into the market for high-priced green hydrogen. Learn who the early adopters are, why they're investing, and how this mirrors the rise of solar PV.

Sustainable aviation fuels (SAF) are alternative fuels that aim to reduce the carbon footprint of aviation by using renewable resources. These fuels are produced from sustainable feedstocks and have lower lifecycle greenhouse gas emissions compared to conventional jet fuels.
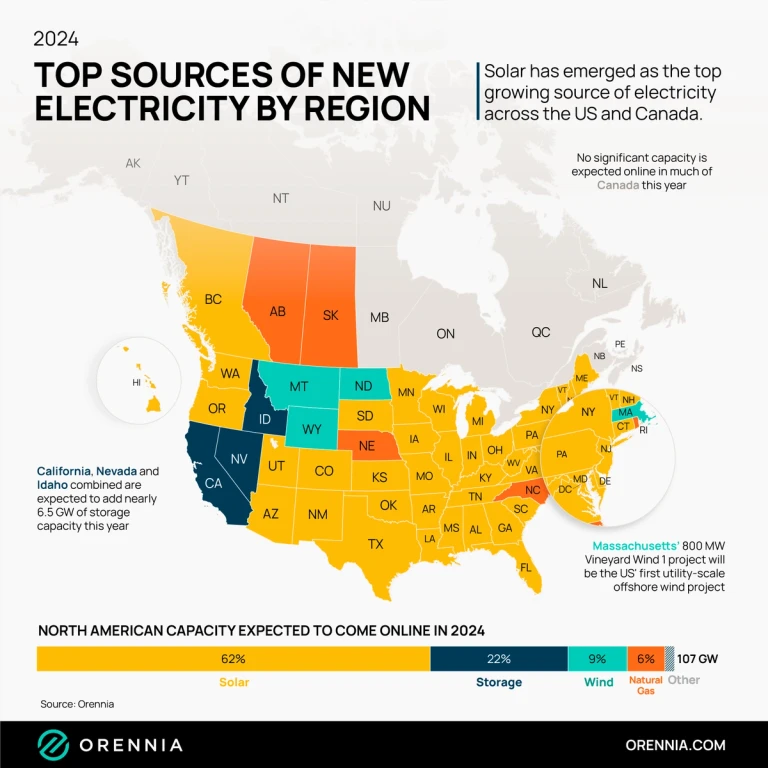
Solar has emerged as the top growing source of electricity across the US and Canada. Learn how these additions will impact the energy landscape.

Batteries, a 200-year-old tech, are evolving fast. LFP advances are driving down costs and accelerating energy storage deployment.

Explore how AI's rising energy demands could challenge electrification and impact decarbonization targets amid growing data center needs.