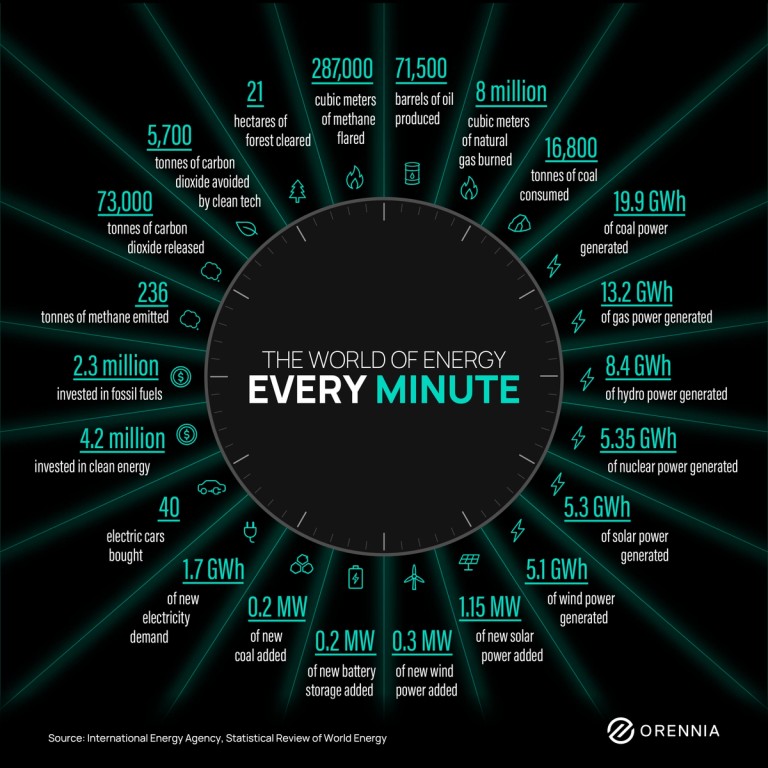
What the Global Energy System Does Every Minute
This infographic outlines the global energy investments made every minute.
This infographic outlines the global energy investments made every minute.
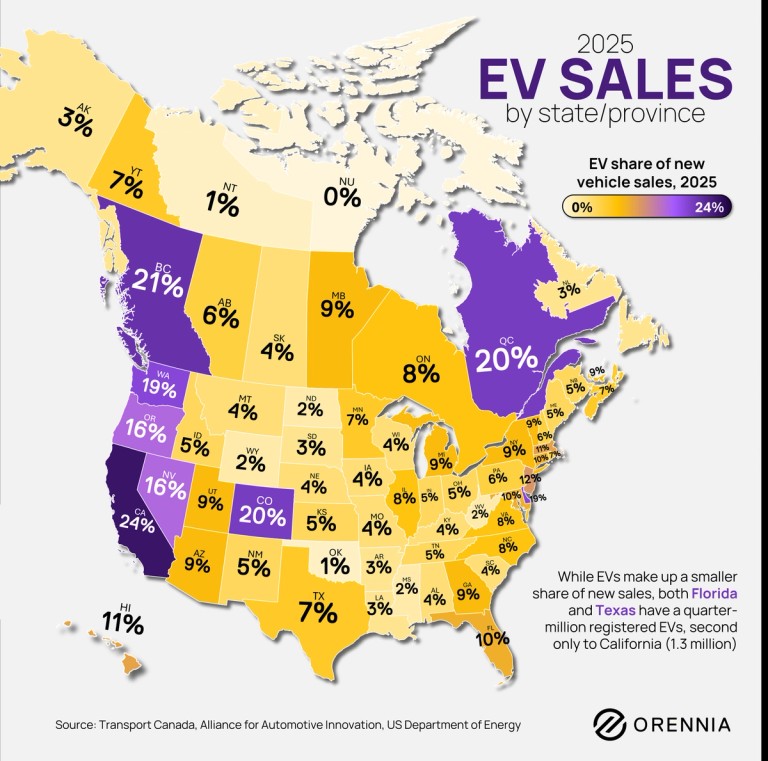
A map view of electric vehicles in every state and province, clearly shows the difference is numbers between Canada and the United States.
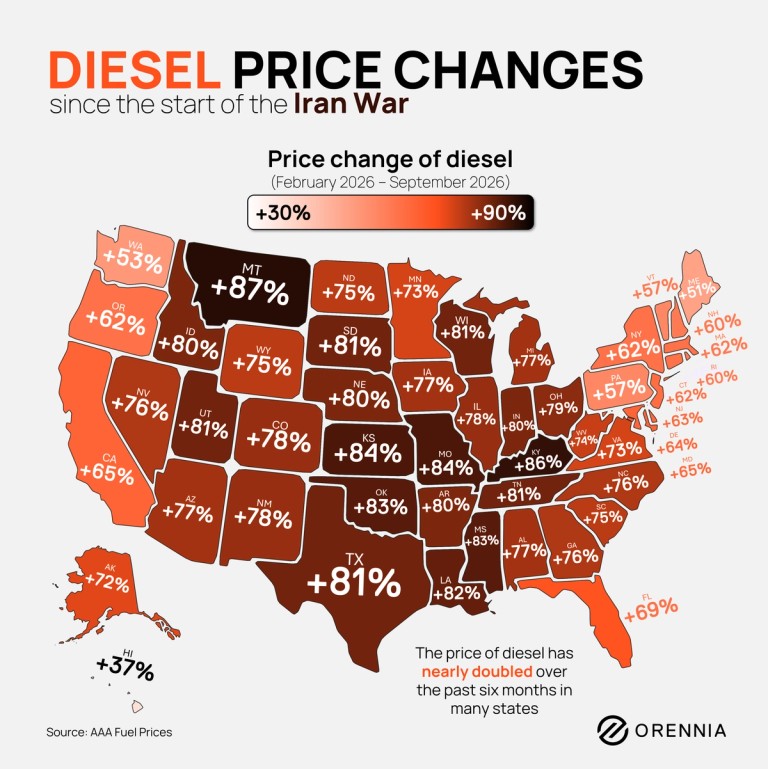
Diesel prices have surged across the US since the Iran war began in late February.
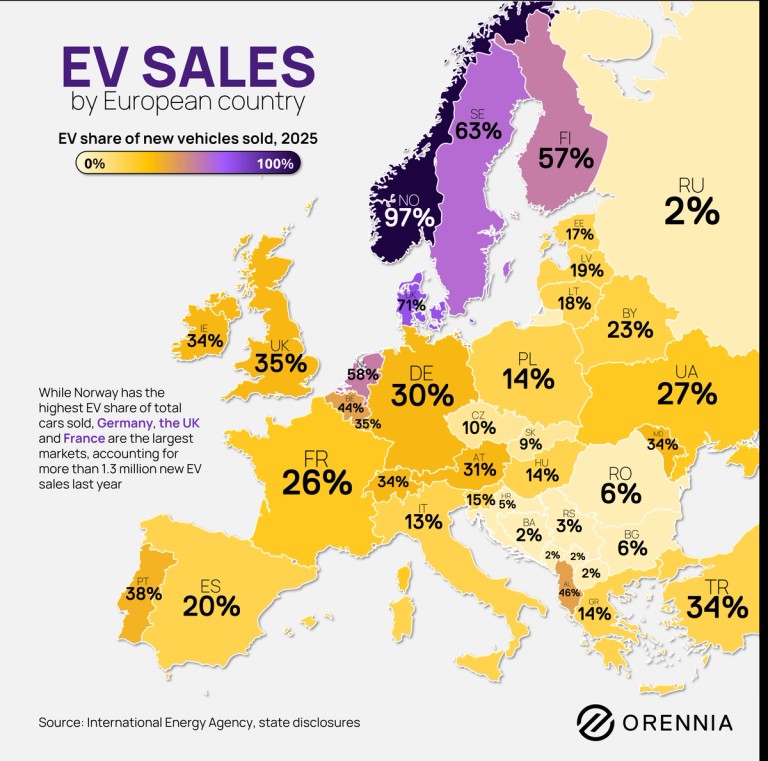
According to data from the International Energy Agency, EV sales in Europe rose more than 30% last year, accounting for 28% of all sales.
Insights for an evolving energy landscape delivered to your inbox.