Mapped: Where Industry Dominates North America's Energy Mix


Map showing industrial energy use in every North American state and province

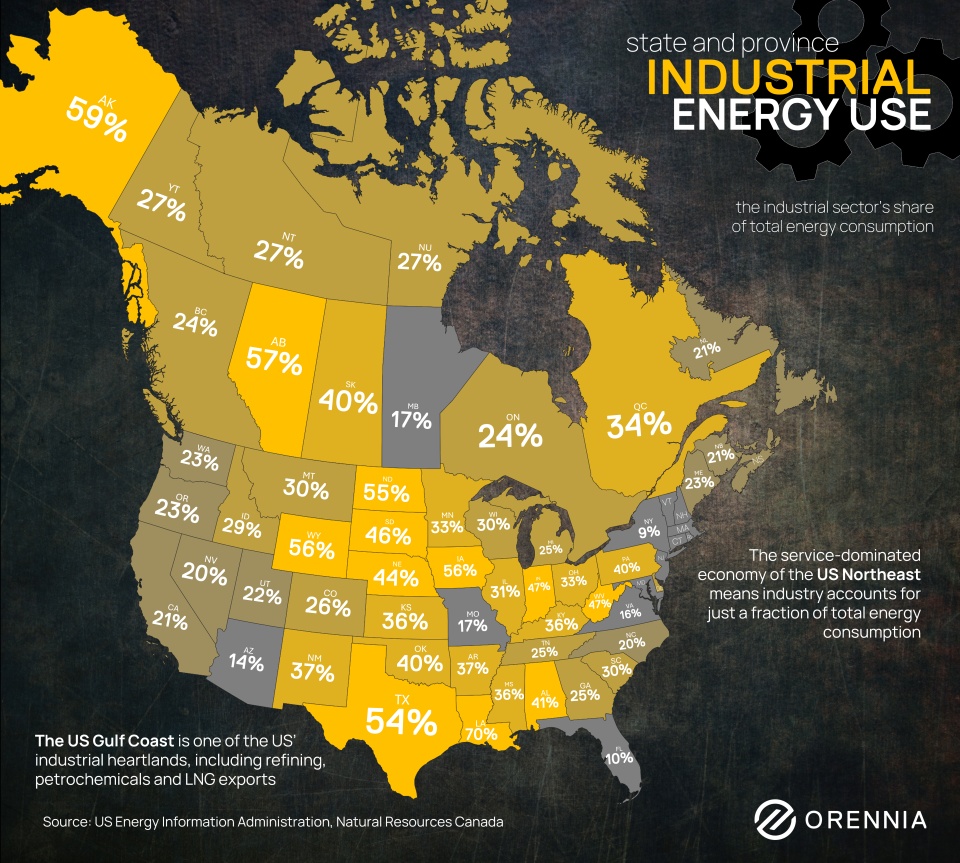
This map shows industry's share of total energy consumption by state and province across North America, highlighting just how unevenly industrial activity is distributed. Data is sourced from the US Energy Information Administration and Stats Canada.

Key regional highlights:

  • The US Gulf Coast is the continent's industrial core, with a dense concentration of refineries, petrochemical plant and a LNG export terminals operating in Louisiana and Texas.
  • The US Northeast barely registers, a reflection of service and consumer-driven economies where industry plays a minor role for energy consumption.
  • The Rust Belt still carries the weight of its manufacturing legacy, with heavy industry remaining a defining in Indiana, Ohio and Illinois.
  • Alberta is a rare industrial island on this map, the result of the enormous energy demands of the Canadian oil sands, which skews the entire provincial energy profile.

The map is a useful proxy for where decarbonization of industry will be hardest and where the economic stakes of that transition are highest. That being said, industrial energy is harder to decarbonize than other sectors, often requiring high-heat processes that can’t easily be electrified.

Newsletter Signup

Data-driven insights delivered to your inbox.