
Aaron Foyer
Director, Research
Aaron Foyer
Director, Research
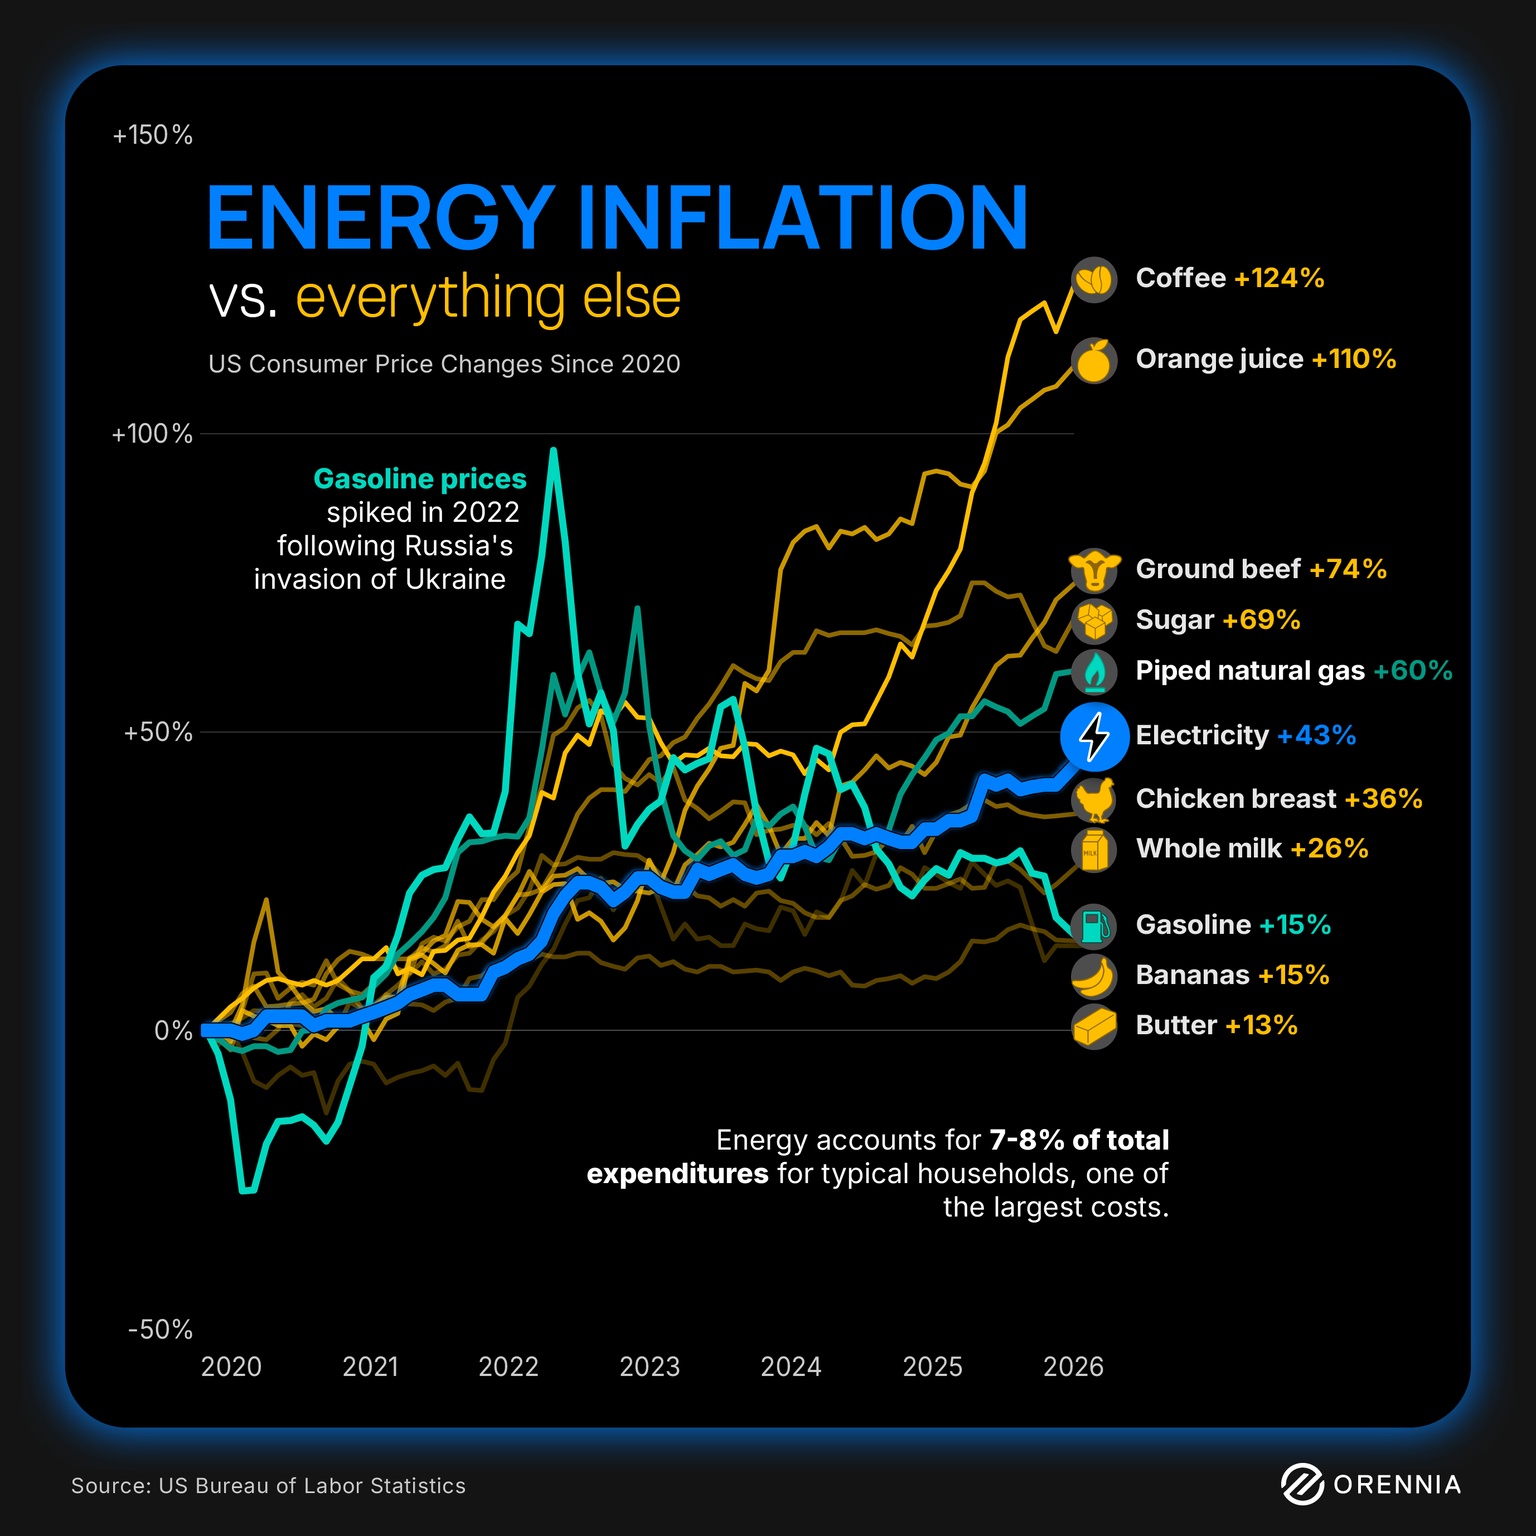
From 2020 through early 2026 in the United States, consumer prices for energy items like electricity, natural gas and gasoline all rose, but several everyday goods, notably coffee and orange juice, climbed even faster.
Tracking Bureau of Labor Statistics data from 2020 through early 2026, the divergence is stark. What the data shows:
Inflation is never just one story. Energy grabs the headlines, but it also quietly pressures food supply chains through higher operating costs that ultimately hit household budgets hardest and longest.
Insights for an evolving energy landscape delivered to your inbox.