Orennia tracks projects through their development lifecycle to evaluate market trends and the competitive landscape. Stay on top of energy transition developments and investment opportunities in solar, onshore wind and battery storage with Orennia's Quarterly Energy Transition Activity Tracker.
Peek inside
Below is a sample of the type of information you can expect when you download the full report.
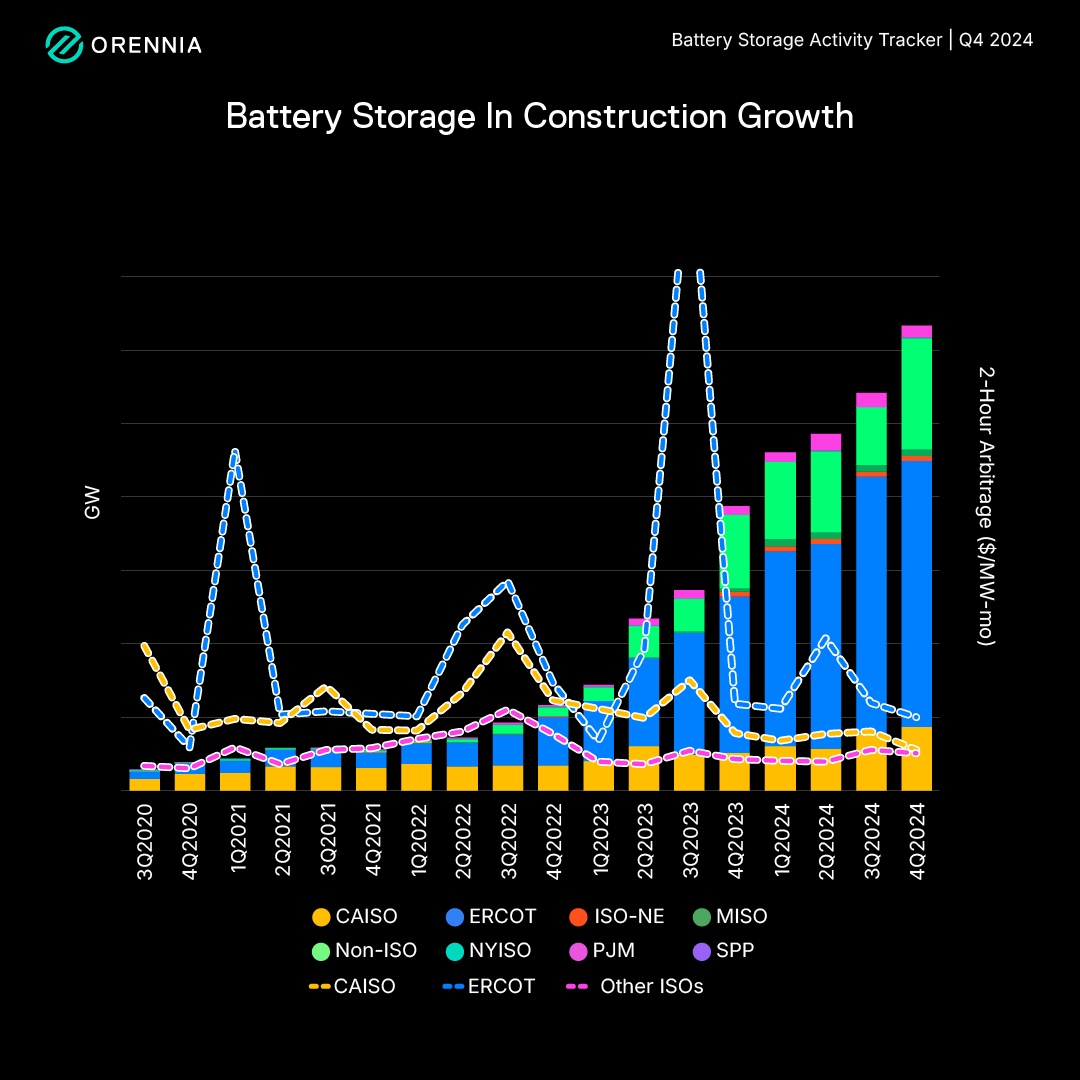
Q4 2024 | Battery Storage Activity
4.4 GW of standalone battery energy storage began construction across the US over Q4 2024, representing a 63% increase YoY.
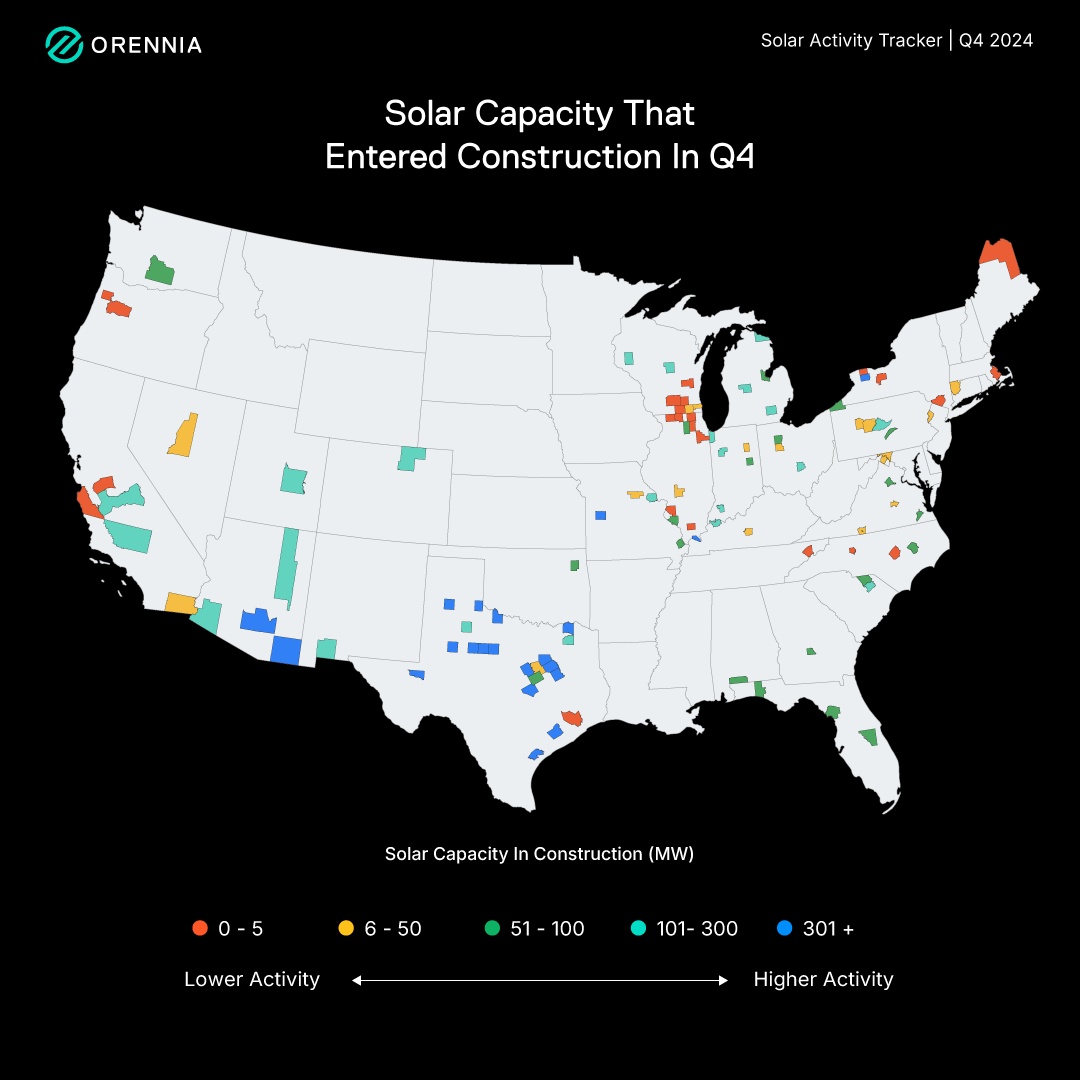
Q4 2024 | Solar Activity
16.5 GW of solar nameplate capacity entered construction across the US during Q4 2024, representing a 32% increase YoY.
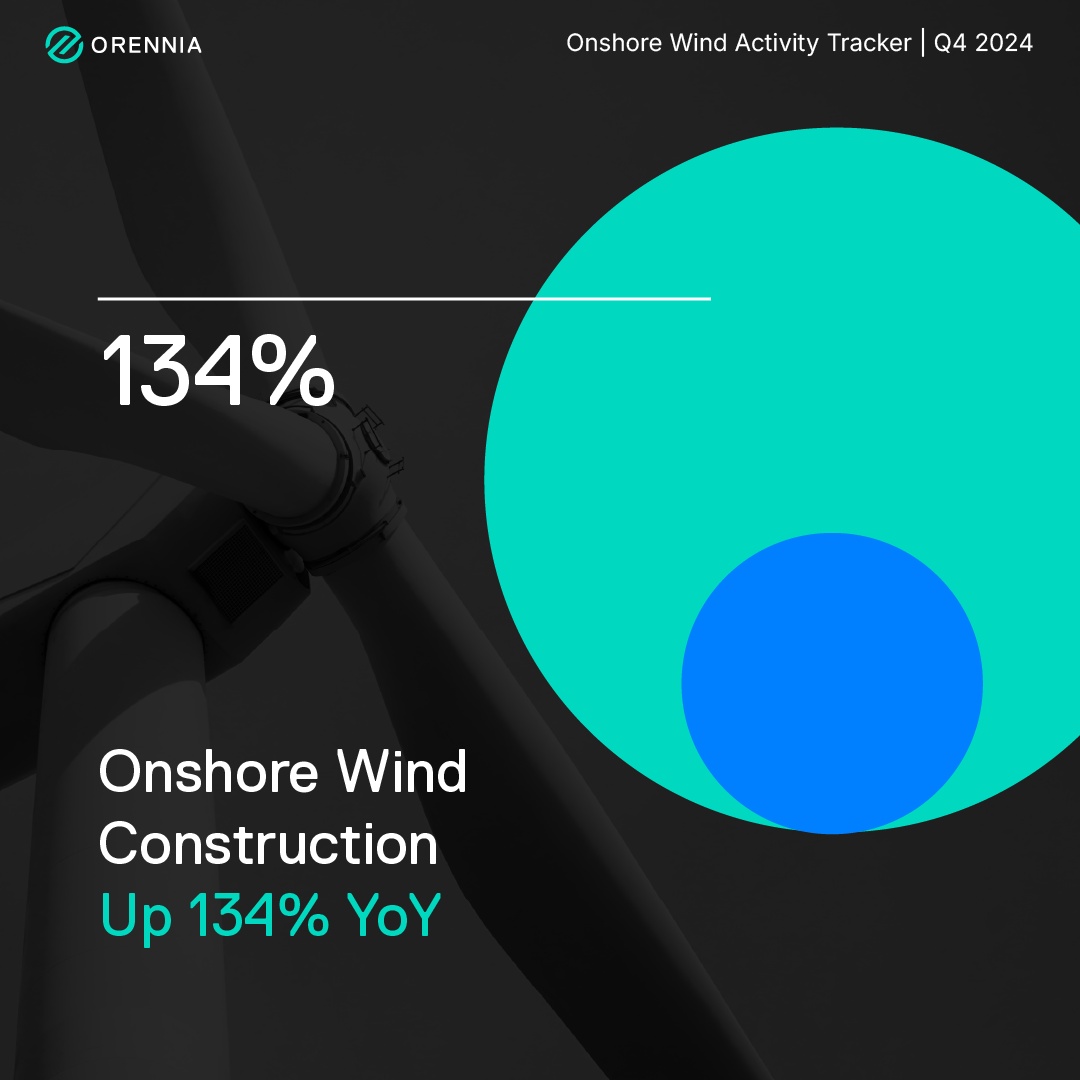
Q4 2024 | Onshore Wind Activity
2.5 GW of onshore wind capacity entered construction across the US during Q4 2024, representing a 134% increase YoY.
Get the full report download
Orennia's Energy Transition Activity Tracker Q4 2024
Complete the form to download the full report.