
Brook Papau
Chief Executive Officer
It starts in the future
Chief Executive Officer
PICARD: It’s like the chicken and the egg, Will, the chicken and the egg! We-we think it started in the past, but it didn’t. It started right here, in the future! That’s why it’s getting larger in the past.
DATA: I think I know what the Captain is talking about. If I’m not mistaken, he’s describing a paradox.
PICARD: Yes, right, that’s it!
Star Trek: The Next Generation, S7E25, “All Good Things…”
Like any business, participants in the energy transition face challenges. What’s unique about this period is that most of the problems stem from being a victim of their own success. While success is at their root, they’re still problems, and CEOs of energy transition companies are paid to mitigate them. Let me explain.
It starts in the future. In America alone, capital expenditures directed to the energy transition are expected to rise to nearly $500 billion, annually, by the end of this decade. The Inflation Reduction Act virtually assures that will happen. To put $500 billion in perspective, in a good year, the oil and gas industry deploys $250 billion per year, which has resulted in cities, counties, and whole states achieving remarkable prosperity. That’s where the energy transition is going.
And companies are gearing up, too. Capital has been forming around this industry for several years. PPAs and other financial instruments have been created to finance projects. Large consumers of energy have made net-zero pledges that require vast quantities of renewable energy. CEOs of a new generation of IPPs, developers and utilities see the opportunity and are moving fast to capture it.
But the industry has become a victim of its own success. There are four forces shaping the energy transition that almost all companies Orennia interacts with are trying to solve.
Most readers will know this, but the process to get projects built in America has stalled out. Interconnection queues (the long lists of projects waiting for approval to get built) have gone parabolic, as evidenced by the figure below. More and more projects are lining up to be built.
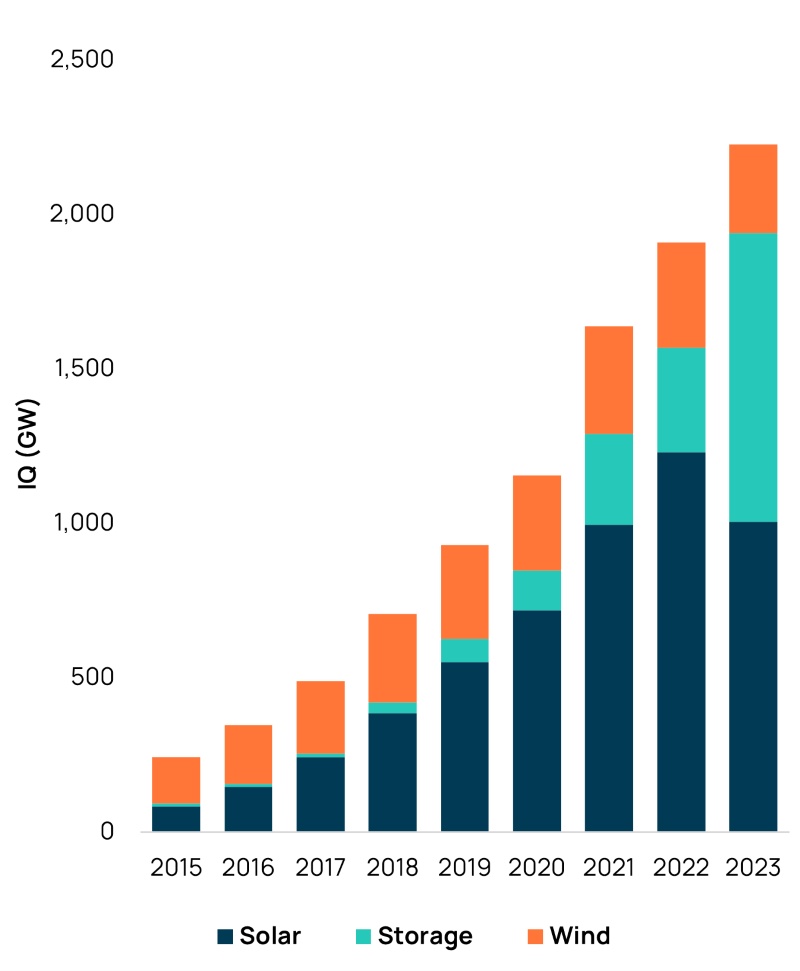
Source: Orennia
Related to the interconnection queue, projects are getting riskier. Fewer and fewer projects, relative to the size of the queue, are getting built. This means more of the work of project developers becomes effectively picking and choosing which projects have the highest likelihood of success. The chart below shows that a project slated for development in the early 2010s had about a 50% chance of being developed, compared to around 15% today.
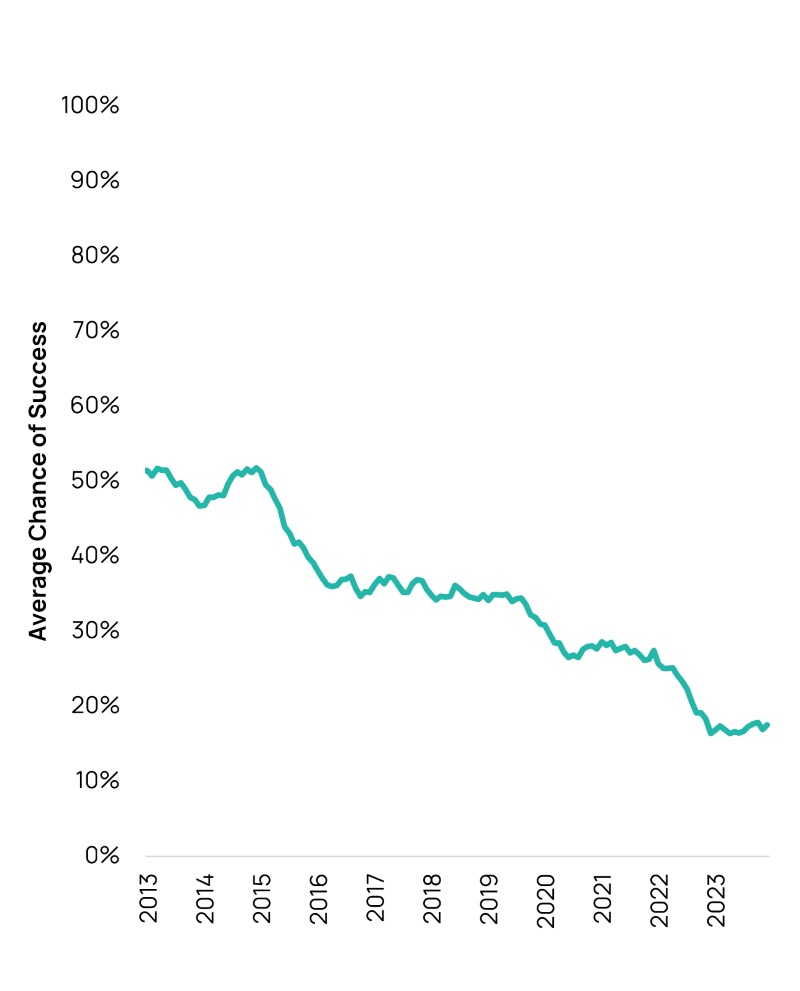
Source: Orennia
New entrants are entering the space at an alarming rate. We estimate there are 200 new firms building their first project every year, and that number is increasing. This new breed of firm is accessing new pools of capital and using new technologies to disrupt incumbents. This unprecedented surge in entrepreneurial energy is taking advantage of niche opportunities.
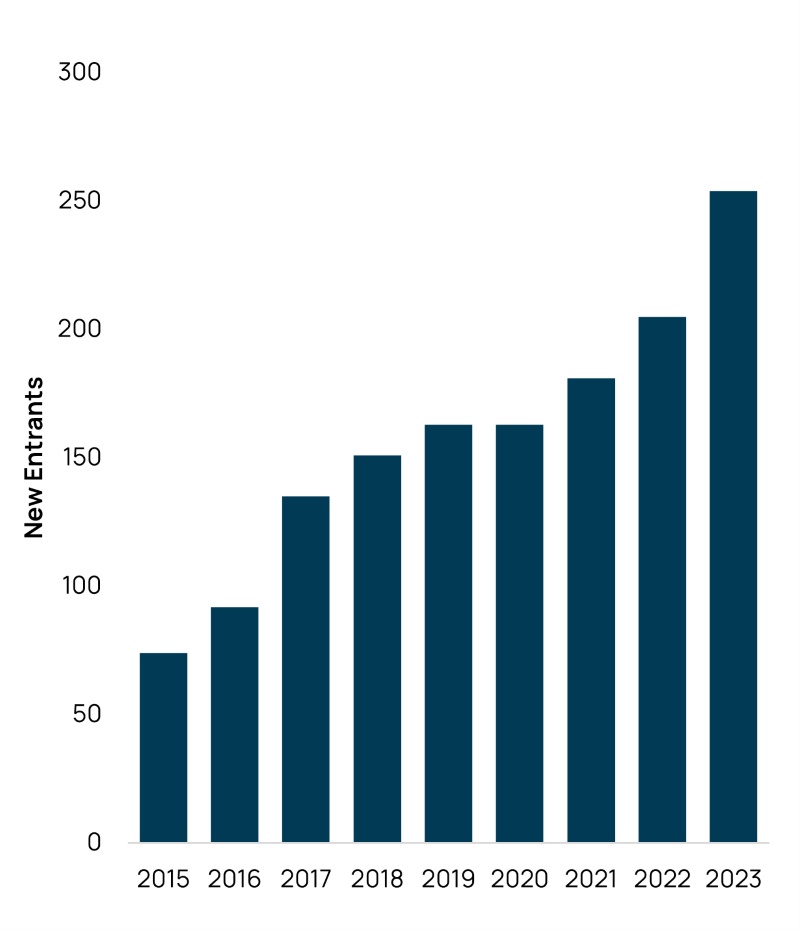
Source: Orennia
Here’s a sobering pair of statistics: The average solar development timeline is 5.2 years while the average analyst tenure is 1.2 years. Meaning that over the life of a project, the analysts would turn over about four times.
Anyone hiring in the energy transition knows that the demand for technical labor is outrageous and many firms are experiencing a revolving door of talent.
Note that at Orennia, we hire across power, renewables, storage, clean fuels, hydrogen and carbon markets (not to mention software engineering!). We’ve been lucky enough to have remarkably low turnover, but we’ve had to be extremely flexible, allocate tremendous resources to recruiting, and foster an employee-focused culture to pull that off.
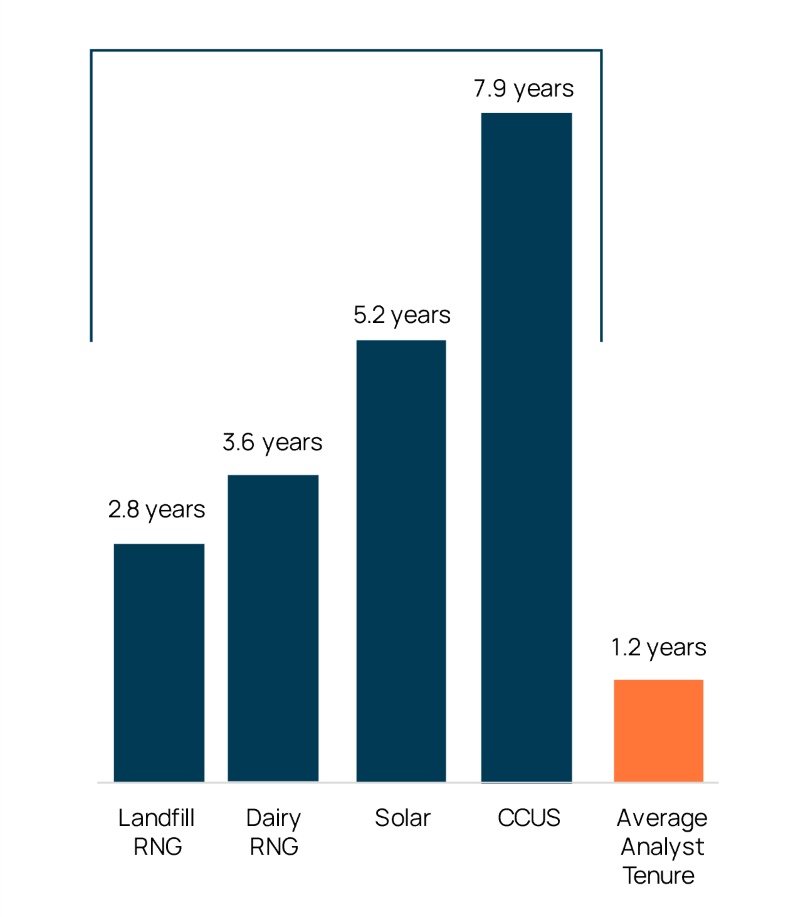
Source: Orennia
We’re in a paradox of success and challenges that start in a future with dramatically higher level of capital expenditures than what we are seeing today. New competitors are emerging, employees are harder to find, and risks are increasing. Orennia was created to offer a solution to this with the promise that access to technology and AI will help firms navigate these challenges. We’re incredibly excited about what comes next.
Data-driven insights delivered to your inbox.