
Aaron Foyer
Director, Research
Examining today's carbon markets
Aaron Foyer
Director, Research
In 1602, at the end of a hot summer in Amsterdam, a hard-working Dutch maid named Neeltgen Cornelis pledged 50 guilders toward a new chartered trading company based out of the Netherlands. While that was a lot for Neeltgen – equivalent to three months’ pay for your average unskilled worker – she was emboldened by the many investors coming and going from her employer’s office to make similar pledges to the new company.
The trading startup was to be known as the Dutch East India Company and went on to be one of the most important companies of the 17th century, though is known more today for its serial misbehaving. The importance of Neeltgen’s pledge wasn’t because of what the Dutch East India Company became, but because of what her investment was a part of: the world’s inaugural initial public offering.
The first stock market: Following the pledge, Neeltgen and the other investors all received fractional ownership shares in the new Dutch trading firm. This quickly spurred the need for the numerous owners to trade — buying and selling company shares. Used initially as an informal meeting place for buyers and sellers of shares, the Amsterdam Stock Exchange was eventually established as the official spot to trade shares. And so, the world’s first modern stock market was born.

Job Adriaensz’ painting The Courtyard of the Stock Exchange from the Amsterdam Museum // Flickr
This moment is often touted as one of the defining moments of Western capitalism. But despite its symbology in the corporate history books, the first stock market wasn’t actually very good.
With traders quoting different share prices to different people, sellers having limited buyer pools and an almost complete lack of regulation, the early stock exchanges were more akin to today’s lawless crypto world than the trusted game-changing financial tool they eventually became. (Sorry, SBF.)
Fast forward: Today’s modern carbon markets share many of the same challenges the early stock exchanges faced: low trading volumes, a lack of price transparency and regulatory issues. Yet for all the challenges of carbon markets, they harbor no shortage of opportunity. Many energy transition projects have gone ahead with the backing of carbon market financing and many more are expected in the future.
So, what’s the state of carbon markets and where are they headed?
Like paper clothing, carbon markets can trace their roots back to the early days of the ’70’s environmental movement. Unlike paper clothing, carbon markets endured and are now used more than ever.
Source: World Bank
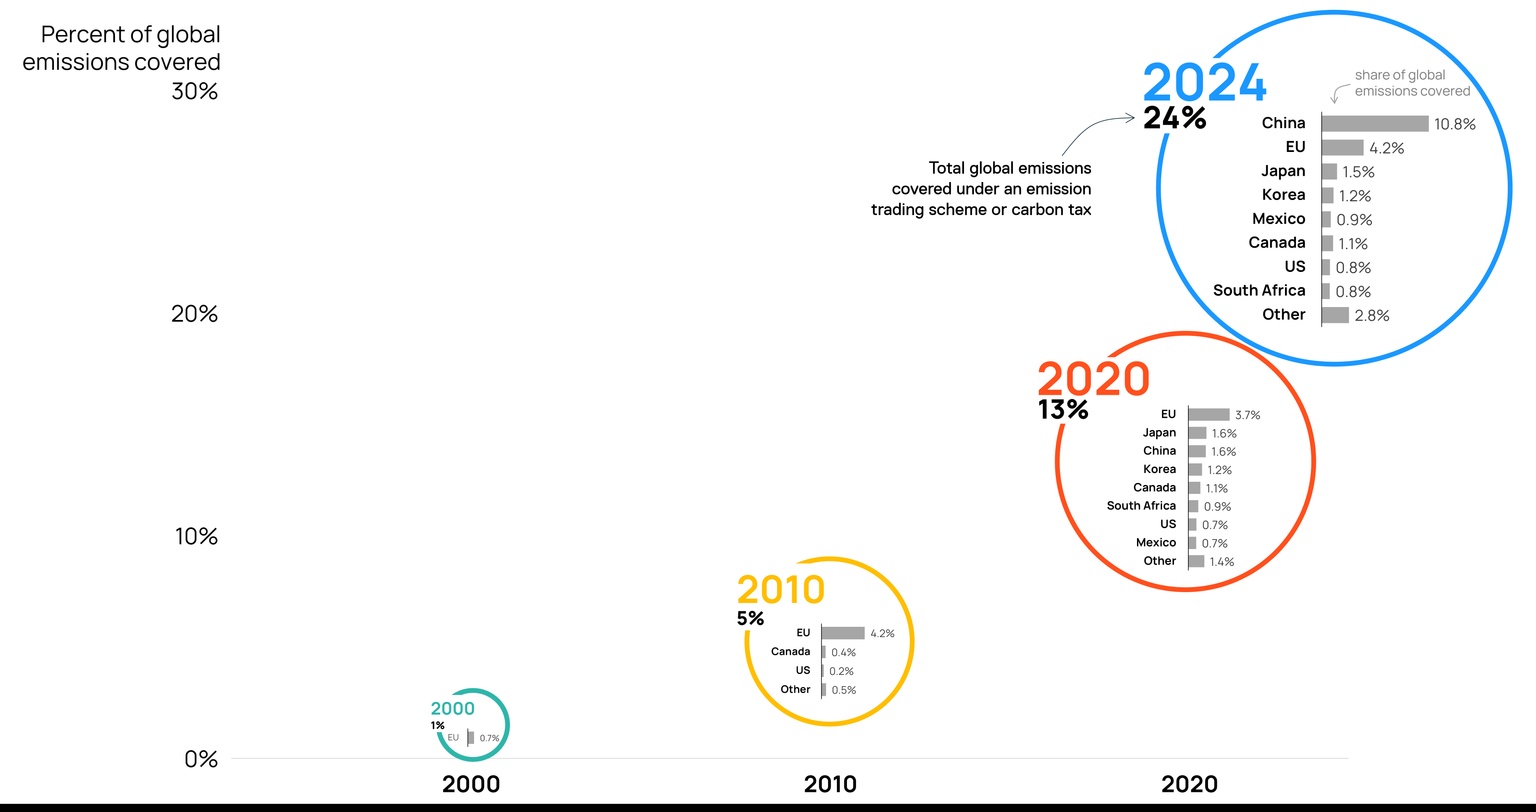
While some early carbon tax systems were introduced by countries such as Poland and Finland, the first true emissions trading scheme (ETS) wasn’t established until 2005 in the EU, known as the EU ETS. Since then, a growing share of emissions have been covered under some sort of carbon price or emissions trading system. The World Bank pegs the total share of emissions covered around the world at 24%, with one-tenth coming from the US and Canada.
Market types: Carbon markets can be divided into compliance markets and voluntary markets. Compliance markets are set by the government with legally binding carbon limits for emitters. In contrast and true to their name, voluntary markets are not mandatory and are mostly carbon offsets that companies buy to meet their sustainability goals.
Since the voluntary markets are a whole other kettle of fish worthy of their own deep dive, let’s focus today on mandatory schemes.
Sitting here in 2024, there is a range of different carbon market types in action across North America. Some are broader markets, which often cover a wide range of sectors, while others are tailored specifically for industry or transportation.
The key North American compliance market types:
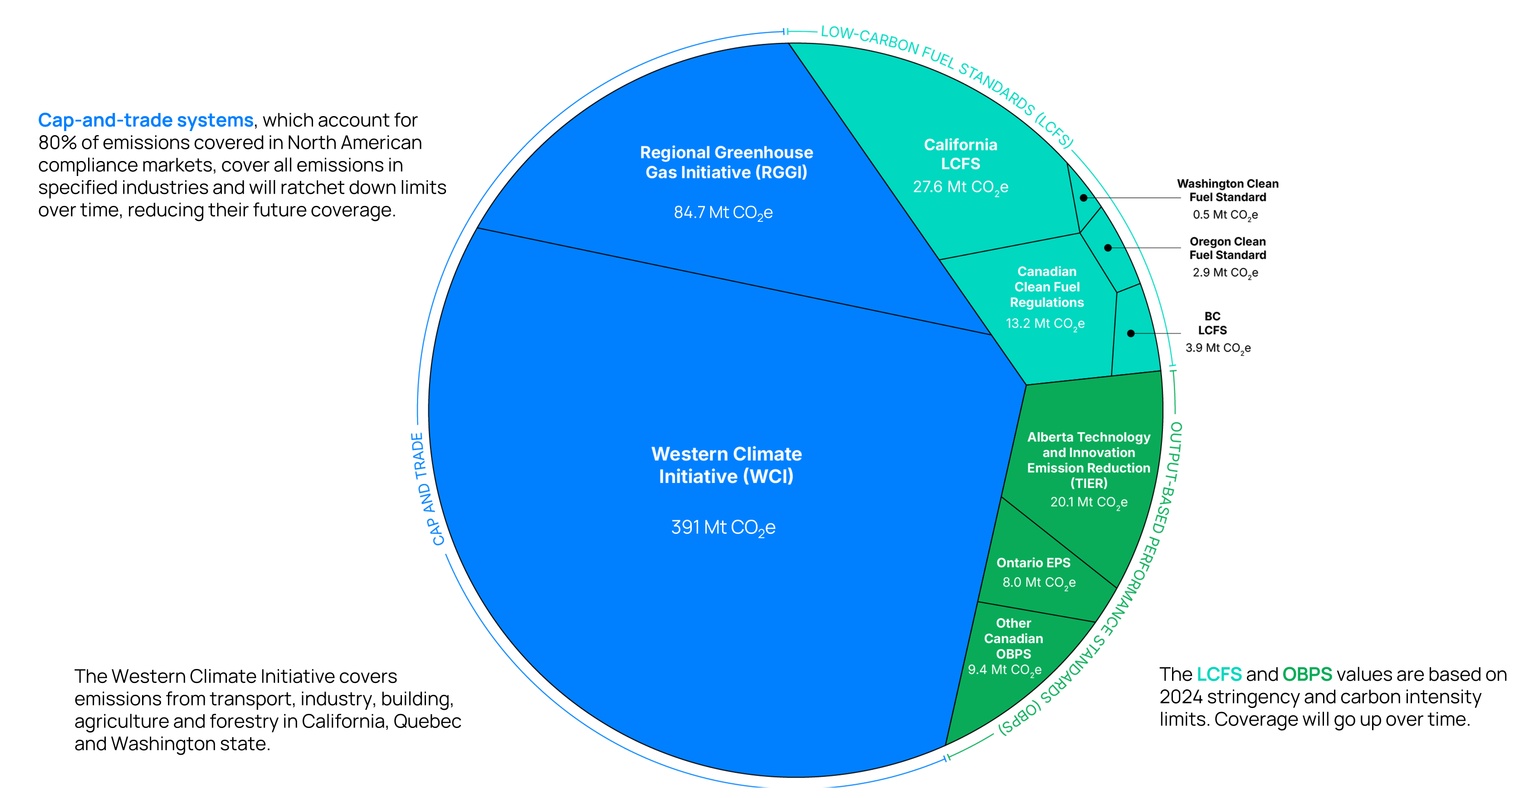
Unlike cap-and-trade, where all emissions are covered right off the bat and then regulators tighten the screws, both LCFS and OBPS type policies start by covering only a fraction of emissions and gradually increase the share over time. This means that today, by almost an order of magnitude, the largest compliance markets in North America are cap-and-trade.
By the numbers: Combined, the WCI and RGGI cap-and-trade markets account for nearly 80% of all emissions covered in North America. This is mostly the result of the WCI, which is larger than the rest of the markets combined.
Data sources: Public disclosures, Orennia estimates
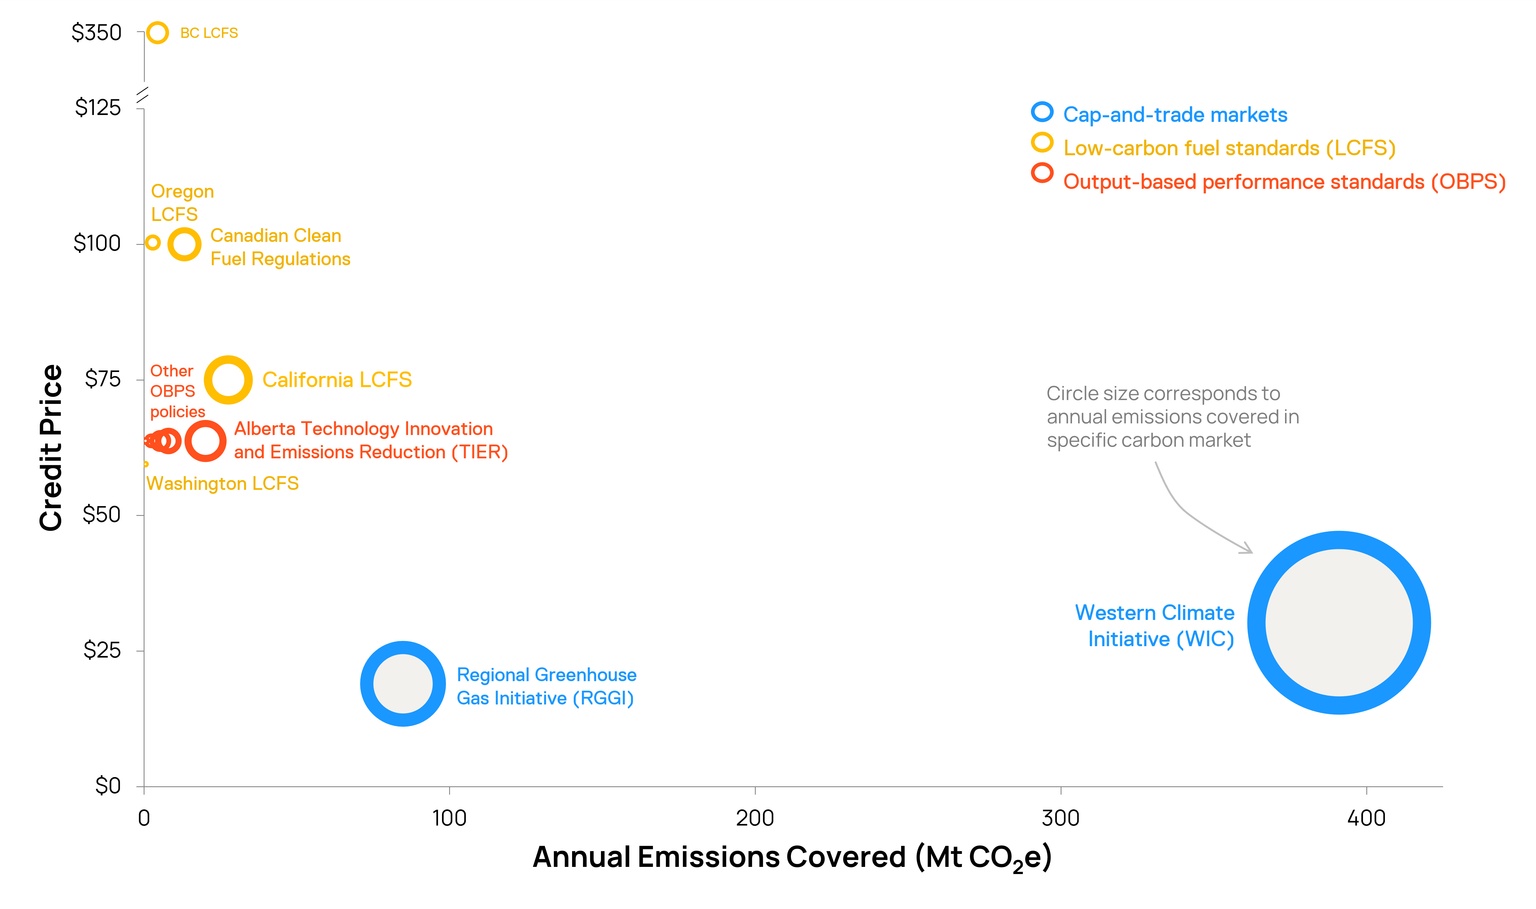
The next part is not intuitive: the volume of emissions covered by a carbon market impacts the underlying carbon price. Larger markets lead to lower credit prices. In the two largest markets in North America, WCI and RGGI, credit prices are trading in the $20 to $30 per tonne range, as of September 2024. For the smaller industrial and transportation LCFS and OBPS markets, credit prices are usually much higher — $60 per tonne and above. In the case of the BC LCFS market, credits have been trading closer to $350 per tonne.
This relationship has both benefits and drawbacks. On one hand, the higher credit prices from smaller markets encourage investment into sectors like transportation and industry, which are both notoriously expensive to address. Incentivizing earlier-stage technologies can help bring costs down, which is a universal benefit. On the other hand, take your economist friend out for a coffee and they’ll tell you the low credit prices in the broader cap-and-trade markets are more market efficient: reducing emissions at the lowest cost to the consumer.
It’s not hard to see the benefits of North America’s carbon markets.
The Golden State goes green: California, the US’ second-highest emitting state behind only Texas, has already seen emissions drop 16% since its LCFS launch in 2011 and subsequent WCI’s launch in 2013. This without almost any coal-to-gas switching, which has benefited most other states, and is instead driven from the industrial and transport emissions targeted by the two programs. This is particularly impressive as, on a national level, emissions from the two sectors have barely budged in ~20 years.
Source: World Bank
And under the RGGI, which focuses on power plant emissions from nine northeastern states, carbon dioxide releases have dropped 50% since 2005, much of that stemming from coal-to-gas switching. The RGGI auctions have raised over $7 billion, which gets put toward energy efficiency, renewable energy and other emission reduction programs in the region.
A TIER above: Lastly, Alberta’s Technology Innovation and Emission Reduction (TIER) regulations are having a year. The slow ratcheting up of OBPS compliance requirements in the system applies pressure on companies to invest in decarbonization. Since late 2023, several billion-dollar industrial projects have been sanctioned under the province’s OBPS system. These include Dow Chemical’s net-zero ethylene plant ($6.5 billion), Linde’s blue hydrogen facility ($2 billion) and Strathcona Resources’ carbon capture projects (up to $2 billion).
While there have been some wins, there’s still work to be done.
Low trading volumes: With both LCFS and OBPS, small carbon markets and limited traders can help drive higher credit prices to fund projects. Nevertheless, they can often have negative impacts, too, as low trading volumes result in higher credit price volatility.
California’s LCFS credit prices dropped ~75% between 2021 and 2024 due to a flood credits from surging production of renewable diesel and other biofuels. Despite being the desired effect of the program, it highlights exogenous risks to financers looking to lend to projects. Corporate bankers don’t typically enjoy white knuckling loans over credit price fluctuations.
Price transparency: Having current and historical credit prices publicly available enables a wider base of potential investors. Some markets do this really well, like the California LCFS market where prices are published daily. Many don’t. Canada’s OBPS markets use private registries, where buyers and sellers log credit sales and system-wide credit details are published after the fact in annual reports, if ever.
This also gives power to large traders, who have an asymmetric information advantage by knowing the range of credit asking prices from the field.
And regulations: While the different markets all have published regulations, they are by no means perfect. Each LCFS has its own set of rules and approaches to measuring a fuel carbon intensity, all which differ. Given fuels are some of the world’s most traded commodities, the lack of cross-border harmonization raises challenges as volumes grow.
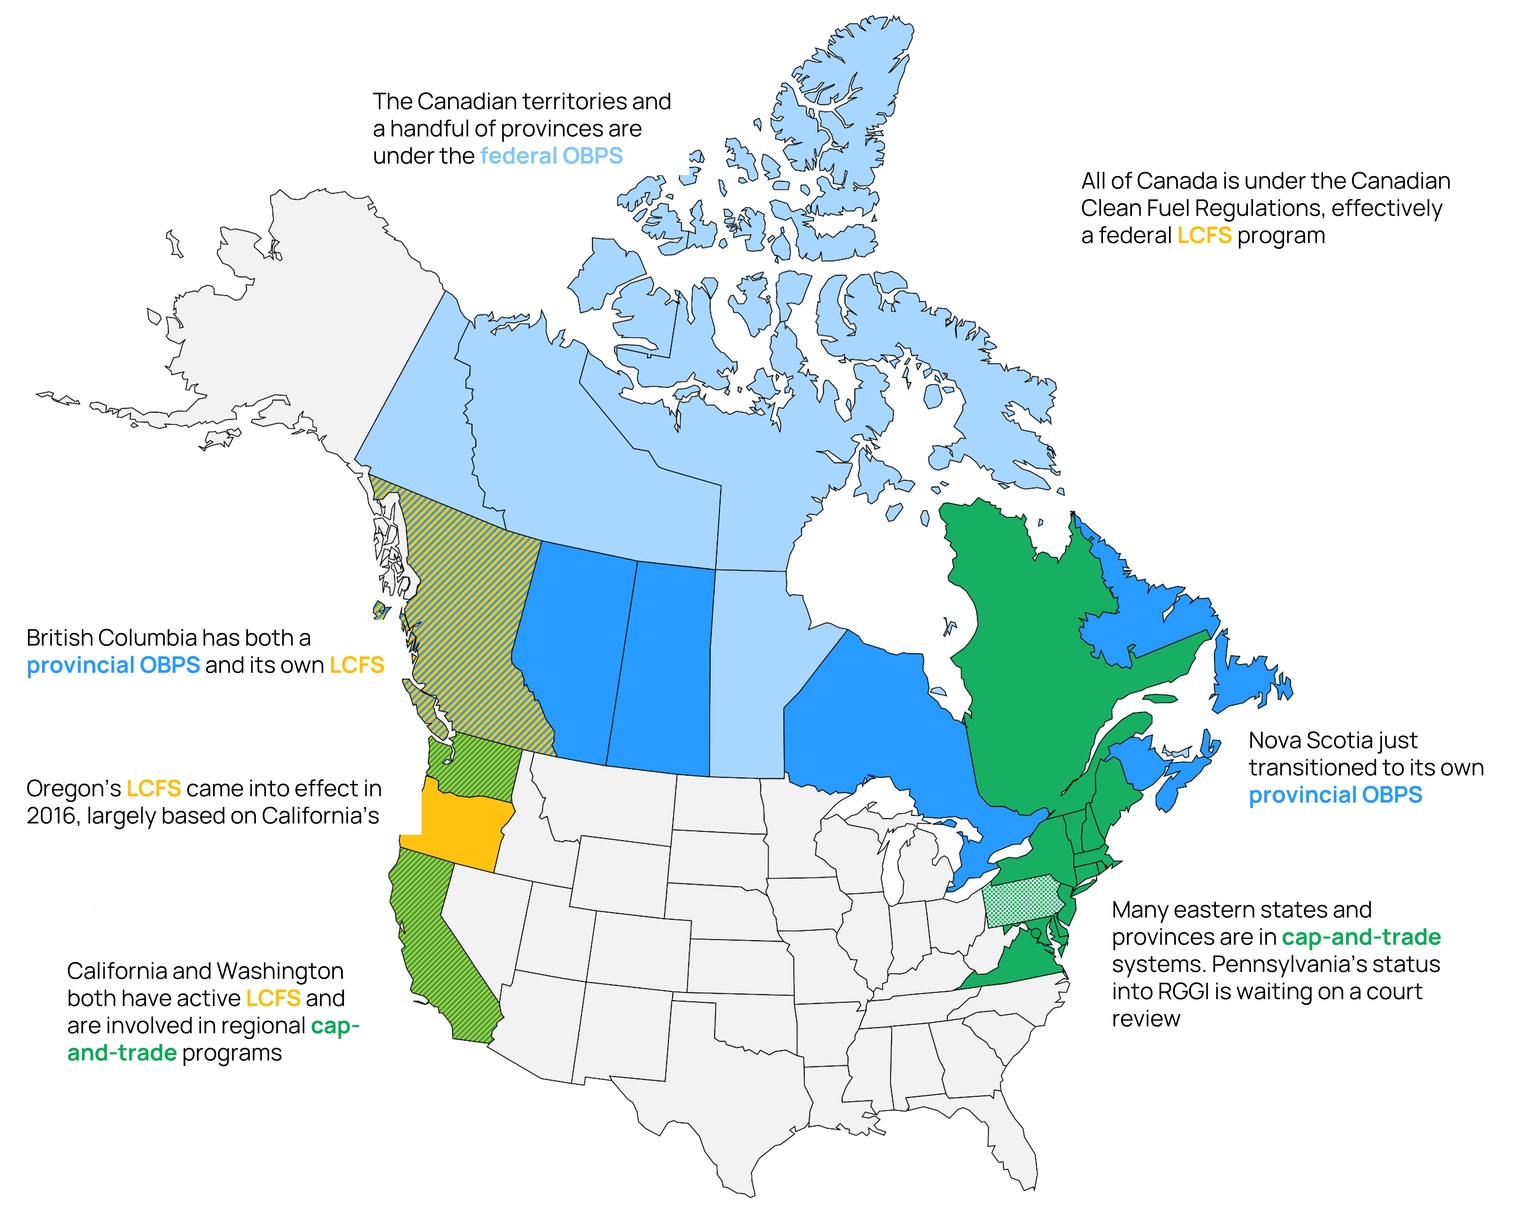
Source: Orennia
And the Canadian federal government’s decision to allow each province the right to create its own OBPS “equivalent” to the federal system was a carrot given for political and constitutional appeasement. Equivalent is in air quotes as they are definitively not equivalent. Instead, there’s now hodgepodge of various production carbon intensities and tightening rates across the country, creating a nightmare for analysts and investors to try to understand. Not to mention siloing the different markets reduces trading partners and creates small–market problems mentioned above.
We’ve long known the cost of emissions. Only now are we learning to monetize their absence using carbon markets. Like the early 17th century stock exchanges, there are some growing pains to work through, and there are encouraging signs.
The Intercontinental Exchange (ICE) recently introduced carbon credit futures, which will introduce more price transparency into the market. And there appears to be growing bipartisan support in the US for a carbon border adjustment mechanism (CBAM). While China may ultimately be the target of a CBAM, it would force harmony across the different compliance markets in things like carbon intensity methodologies for fuels.
Bottom line: Standardization was the most lasting impact of the first stock exchanges. By making a consistent process for issuing shares, reporting prices and distributing dividends, many of the inherent risks with investing were addressed. Expect the same with carbon markets as they continue to grow and evolve.
Insights for an evolving energy landscape delivered to your inbox.